Discussion
By evaluating environmental risks to U.S. health and health care as well as the sector’s own emissions, the Commonwealth Fund State Scorecard on Climate and Health aims to inform policy and operational efforts that can help ensure health care systems are both resilient and low-polluting.
The scorecard’s findings show that across states, both coastal and inland, health care facilities are vulnerable to extreme weather events like hurricanes, floods, severe storms, wildfires, and extreme heat. As climate change accelerates, many facilities are unprepared for these mounting threats.
The scorecard also finds that states whose clean energy policies are weak and more dependent on fossil fuels have higher emissions from health care and greater health impacts from electricity generation. In contrast, states with strong clean energy and energy efficiency policies performed better. As pollution does not respect state boundaries, policies in one state may affect the health of millions of Americans downwind. Federal environmental policies are critically important to protect the health of all Americans and save tens to hundreds of billions of dollars annually in avoided health care costs.31
The Path Forward
To improve their resilience and limit harmful health impacts, health care systems will need to integrate climate projections into their hazard vulnerability analyses and infrastructure planning, supported by high-quality meteorological data. Mandatory, standardized, and transparent GHG emissions reporting by health care facilities and their suppliers at the federal and state levels can also guide evidence-based policies and strategic management, as well as ensure accountability for mitigation efforts. States should also take action to promote the decarbonization of their energy sources and support greater energy efficiency — especially those states whose populations are facing poor air quality.
In highlighting the complex relationship between health care systems and the environment, the scorecard’s findings point to the need for coordinated state and national policy interventions that can help bring about more sustainable and resilient health care systems. Levers for action include federal and state regulations and payment incentives, standardized emissions reporting and decarbonization requirements, and centralized data repositories that support evidence-based actions to mitigate risk, bolster resilience, and ensure the safety and quality of health care for all.
States should also prioritize a health-in-all-policies approach, recognizing that energy, infrastructure, industrial, and environmental policies are all key determinants of health and essential for protecting both people and health care systems.
The need for more and better data is especially urgent. At present, only 29 percent of U.S. hospitals report at least some of their GHG emissions and energy use publicly, largely a result of federal requirements, state laws, and voluntary programs.32 However, the data reported are inconsistent and incomplete, suggesting a strong need for standards to ensure that information is verifiable, comparable, and actionable.33 Comprehensive climate risk data and assessments also remain sparse, not only for health care facilities and infrastructure but also across health care supply chains and suppliers.34
Regulatory incentives from federal and state agencies and organizations that already have the capabilities for centralized data reporting and oversight — such as the Centers for Medicare and Medicaid Services’ Transforming Episode Accountability Model, designed to improve the quality and cost effectiveness of care for Medicare beneficiaries, and The Joint Commission’s Sustainable Healthcare Certification program — can help spur energy and environmental management action within health care organizations.35 Such incentives encourage data collection and sustainability management activities around energy use, purchased electricity, anesthetic gas use, pressurized metered-dose inhaler use, transportation, and waste disposal.
Even in the absence of regulations, health care facilities have many opportunities to improve their resilience and sustainability and better support the health of the communities they serve. Some steps they can take include: investing in energy efficient and climate-resilient facilities, purchasing reusable and other environmentally preferable products, reducing waste and emissions, and investing in clean energy. Such voluntary actions build momentum within the health care sector toward a more safe and sustainable model of care.
Summary of Recommended Actions
What federal policymakers can do:
- Maintain the United States’s energy efficiency and decarbonization trajectory, enabled by strong climate change mitigation goals.
- Uphold bedrock environmental regulations, such as the Clean Air Act, that safeguard American public health.
- Support research efforts and public education by maintaining and regularly updating federal databases and tools addressing environmental hazards and climate risks to human health and safety.
- Facilitate better implementation of Hazard Vulnerability Analyses by backing state and local climate risk assessments and providing methodological support for health system resilience planning.
- Require standardized, transparent, and verified reporting of climate risks and emissions by health care facilities.
- Facilitate centralized data repositories for health system sustainability metrics to support progress tracking, accountability, and evidence-based actions.
What state and local policymakers can do:
- Prioritize decarbonizing energy sources and improving efficiency, through mechanisms like renewable portfolio standards and updated building energy codes, to reduce emissions and protect public health.
- Evaluate and improve climate action plans, including GHG-reduction targets, cross-sector decarbonization goals, hazard and vulnerability assessments, and adaptation measures.
- Set health care decarbonization goals and incentive performance improvement through payment reforms in Medicaid as well as private and employer insurance.
- Prioritize building resilience to extreme weather; expand public health investment in relief centers and early warning systems, especially in high-risk areas.
- Require standardized, verified, and transparent reporting of greenhouse gas emissions, strategic planning, and mitigation targets by health care facilities and their suppliers.
What health care systems can do:
- Assign executive-level sustainability responsibility and employ designated leaders at each health care facility.
- Collect and report sustainability and resilience data in areas prioritized by the Centers for Medicare and Medicaid Services and The Joint Commission.
- Engage in collaborative learning through the exchange of implementation lessons and evidence-based best practices with other health care organizations.
- Analyze and publicly report direct and indirect emissions using established corporate sustainability standards, ensuring that all data are verifiable.
- Conduct Hazard Vulnerability Analyses for health care facilities, incorporating climate projections using local data.
- Account for projected climate risk in capital project planning.
- Incorporate climate change considerations into Community Health Needs Assessments and Community Health Improvement Plans.
- Purchase reusable and environmentally preferable products and champion waste reduction and clean energy.
- Prepare for higher patient loads and potential service disruptions from extreme weather events.
- Support low-emission transportation options for staff and patients, including through effective connections to existing infrastructure.
How We Conducted This Study
We chose the final set of eight indicators by first identifying key sustainability challenges and threats to human health and health care infrastructure stemming from climate change.36 Considering these areas, we reviewed publicly available data sources with nationwide coverage at the state or local level. We selected data that were scientifically valid, reliable, unbiased, and updated annually. After initial selection, the indicators and methods were reviewed by an expert panel to confirm their relevance and robustness.
While we used the most reliable, comprehensive data available, it’s important to note the inherent limitations of environmental hazard data at the state, or even county, level. For instance, air quality can vary within neighborhoods, and local flood data provide a more complete picture of risk that national or state models may not fully capture. This is addressed by our recommendations for states and health care facilities to use local environmental and climate projection data when conducting risk assessments and resilience planning.
Data
The data for these indicators span the period 2020 to 2024, reflecting the most recent year available at the time of scorecard development. For indicators derived from existing indices or models, such as the Natural Risk Index, Heat and Health Index, and Smart Location Calculator, a compilation of historical data was used in their development. The data year or index release year and data source for each indicator are detailed in the Appendix.
Environmental hazards have only worsened since we collected data for this scorecard, and they are projected to continue escalating because of climate change. Still, the indicators provide a baseline assessment of environmental risk, offering actionable insights for policymakers and health care facilities to guide informed decision-making.
Calculation of Overall State Scores
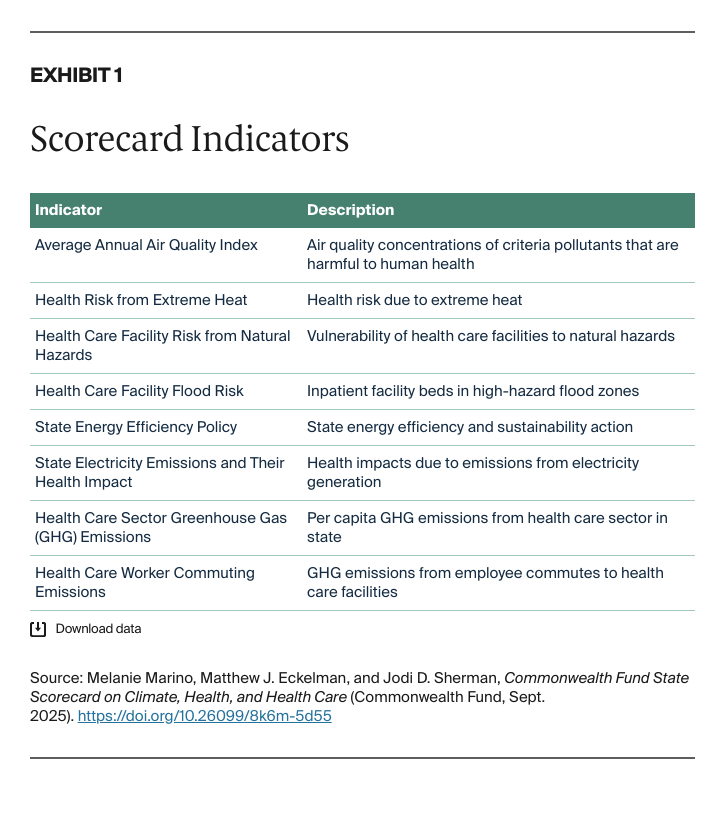
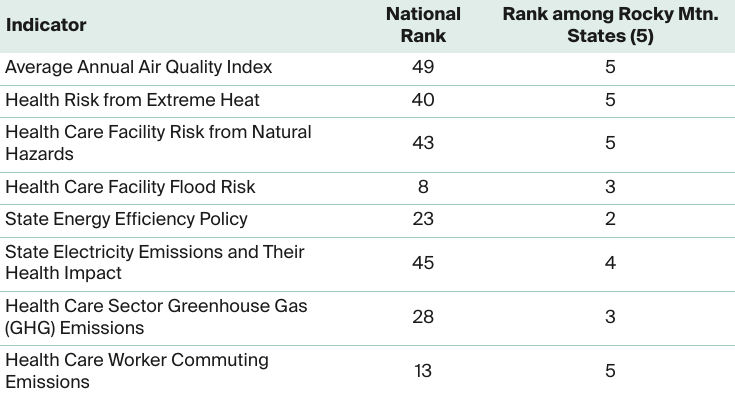
We calculated states’ overall scores based on eight indicators, with each weighted equally:
- Average Annual Air Quality Index
- Health Risk from Extreme Heat
- Health Care Facility Risk from Natural Hazards
- Health Care Facility Flood Risk
- State Energy Efficiency Policy
- State Electricity Emissions and Their Health Impact
- Health Sector Greenhouse Gas (GHG) Emissions
- Health Care Worker Commuting Emissions
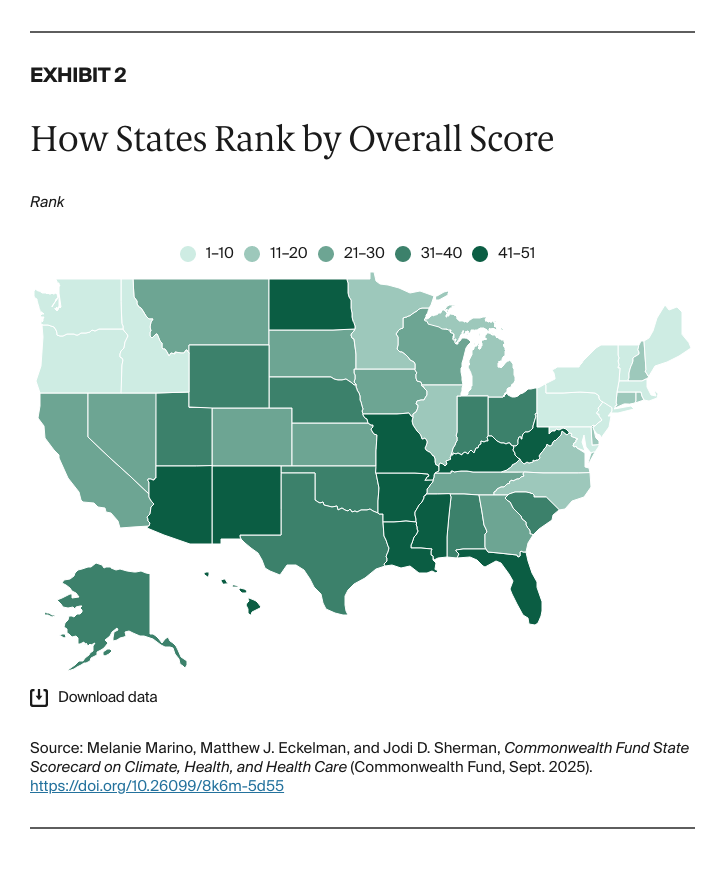
For each indicator, the standard score, or z-score,37 was computed as the difference between the observed value and the average, divided by the standard deviation. These z-scores were then adjusted to reflect the directionality of the indicator — whether higher or lower values indicate better or worse outcomes. The overall score was determined by averaging the z-scores across all indicators. Finally, states were ranked based on their overall score.
Appendix. Indicator Descriptions and Methods
Average Annual Air Quality Index
The Air Quality Index (AQI) is calculated from five major air pollutants that impact public health: ground-level ozone (smog), particulate matter, carbon monoxide, sulfur dioxide, and nitrogen dioxide. Higher AQI values indicate poorer air quality, while lower values signify better air quality. “Good” air quality falls within an AQI range of 0 to 50.38 The national AQI is a population-weighted average of county-level AQIs, reflecting air quality experienced by the average person. Typically, the per-person air quality is worse than the overall average, as densely populated urban areas often have higher pollution levels than rural areas.
Using county-level, daily AQI data for 2022, from the EPA, the mean annual AQI was found for each county. Weights were determined by per capita observations for each county in each year. In other words, the weights for each county were calculated by dividing the county population by the sum of county populations with AQI observations. This approach was taken instead of dividing the county population by the total state population, as AQI data are not available for every county. Weights were then applied and the average AQI was calculated for each state.
Health Risk from Extreme Heat
The 2024 Centers for Disease Control and Prevention (CDC) Agency for Toxic Substances and Disease Registry (ATSDR) Heat and Health Index (HHI) indicates which areas are most likely to experience negative health outcomes from extreme heat exposure.39 Indicators are grouped into four dimensions — historical heat and health burden, sensitivity (preexisting conditions), sociodemographic factors, and natural and built environment factors. All dimensions are weighed equally, and the dimension rankings are averaged to create an overall HHI score between 0–1, with 1 indicating the highest risk.
The Heat and Health Index Scores are provided at the ZIP Code Tabulation Area (ZCTA) level, so the weighted average of the scores for each state was taken. The weights for each ZCTA were determined by dividing the population of each ZCTA by the sum of ZCTA populations for the state with HHI scores. This approach was taken instead of dividing each ZCTA population by the total state population, as HHI data are not available for every ZCTA.
Calculations for Hawaii and Alaska were not possible due to unavailability of data for some indicators. For the Extreme Heat Days indicator under Historical Heat & Health Burden, the data source (National Land Data Assimilation System, NLDAS-2) provides meteorological data covering the entirety of the United States, except Alaska and Hawaii.40
Health Care Facility Risk from Natural Hazards
The FEMA National Risk Index (NRI)41 quantifies risk as the potential for negative impacts as a result of a natural hazard.42 The 18 natural hazards included in the NRI are avalanche, coastal flooding, cold wave, drought, earthquake, hail, heat wave, hurricane, ice storm, landslide, lightning, riverine flooding, strong wind, tornado, tsunami, volcanic activity, wildfire, and winter weather. In the NRI, natural hazards are represented in terms of Expected Annual Loss (EAL), calculated by multiplying exposure (potential impact on buildings, population, or agriculture), annualized frequency, and historic loss ratio (percentage of exposed value typically lost). The component of the NRI of interest is the EAL Score. The EAL value is expressed in 2022 dollars, while the EAL Score is a normalized, unitless value ranging from 0 to 100, where 100 represents the highest level of risk.
Health care facility location data are from the Health Resources and Services Administration (HRSA) dataset, containing Providers of Services (POS) Facilities Data from the Centers for Medicare and Medicaid Services.43 This is a comprehensive dataset that contains information on approximately 80,000 health care facilities that participate in Medicare and/or Medicaid programs, representing a substantial portion of facilities in the United States. This dataset was filtered to include facilities within the 50 states and cleaned to eliminate facilities with null geometry fields. The dataset includes a large variety of facilities, including hospitals, clinical laboratories, home health agencies, ambulatory surgical centers, long-term care facilities, and hospices.
To look at how the NRI interacts with health care facilities, we used the NRI shapefiles, with NRI data disaggregated to the census block group level, and the health care facilities dataset. From this, the census block group EAL Scores were assigned to the health care facilities located in the corresponding census block groups. Then, for each state, an average EAL Score was determined based on all the facilities in the state.
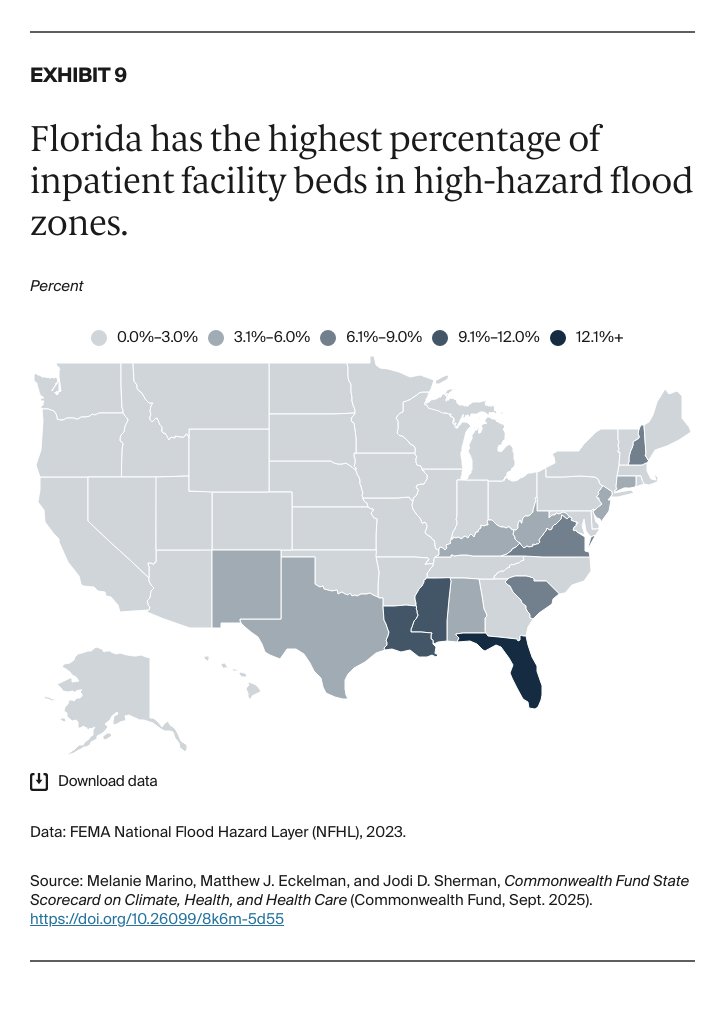
Health Care Facility Flood Risk
This indicator uses FEMA’s USA Flood Hazard Area Feature Layer, derived from the November 20, 2023, version of the National Flood Hazard Layer feature class “S_Fld_Haz_Ar” (Special Flood Hazard Areas). Flood zone areas of minimal and undetermined hazard were removed from the dataset, as well as areas with no data.44 Health care facility location data were pulled from the previously introduced HRSA dataset. This dataset was filtered to only include facilities with data on the number of beds — hospitals, residential treatment facilities, and nursing facilities — resulting in a total of 27,127 facilities and 2,822,303 beds.
Analysis of the Flood Hazard Areas layer was done in ArcGIS Pro. Flood hazard area designations were assigned to each of the health care facilities by performing a spatial join — determining if each facility fell within a flood hazard area. Using Python, the facility-level data, with a field indicating the number of beds at the facility, were aggregated to the state level. For this metric, areas of moderate flood hazard (Flood Zone X) were not included. Most inpatient facility beds in flood hazards are in Zone X and including this in the metric skews the picture of which states are facing the highest risk of flooding for their health care facilities. Beds in high-risk areas, areas that face 1 percent or greater annual chance of flooding, are the focus of this indicator. For each state, the number of beds in high-risk areas was totaled and divided by the total number of beds in the state, to determine the percentage of beds at high risk of flooding.
State Energy Efficiency Policy
This indicator draws from the 2022 American Council for an Energy-Efficient Economy (ACEEE) State Energy Efficiency Scorecard.45 It covers key topics of interest such as state emission reductions goals, zero-energy buildings policy, code compliance, transportation emissions policy, and other energy efficiency policy metrics.
Of the 50 total points possible, 30 percent are allocated to utility and public benefits program and policy metrics, 26 percent to transportation policies and programs, 24 percent to building energy efficiency policies, 9 percent to state-led initiatives, 5 percent industrial energy efficiency policies, and 6 percent to state appliance and equipment standards. The precalculated scores from the scorecard were used, and detailed methodology can be found in the ACEEE State Energy Efficiency Scorecard research report.46
State Electricity Emissions and Their Health Impact
Electricity emissions intensity data were taken from the Emissions & Generation Resource Integrated Database (eGRID) by the EPA, a comprehensive source of data on the environmental characteristics of almost all electric power generated in the U.S.47 eGRID considers the entire electricity generation mix of a state, including both renewable and nonrenewable sources, providing a holistic view of a state’s overall environmental impact from electricity production. Although eGRID 2022 data are available, 2021 data were used so that PM2.5 data, only available for 2021, could be incorporated in this indicator. The EPA uses National Emissions Inventory (NEI) data to determine PM2.5 emissions at electric generating units.
Annual output emissions rates are calculated by eGRID, as total annual adjusted emissions divided by annual net generation. State output emissions rates for CO2e, SO2, NOx, and PM2.5 were extracted from eGRID. To normalize the emissions rates, they were converted into terms of human health impacts, or Disability-Adjusted Life Years (DALYs) per unit of electricity generation (MWh). This was done using endpoint characterization factors from ReCiPe 2016 impact assessment method.48
Health Care Sector Greenhouse Gas (GHG) Emissions
We calculated health care sector greenhouse gas (GHG) emissions by using the EPA’s U.S. Environmentally Extended Input-Output Model, USEEIO v2.0.1-411.49 USEEIO is an environmental-economic model of U.S. goods and services. This model combines economic data on industry inputs and outputs with environmental data on resource use and pollutant emissions. Further information on methods and data used for the construction of USEEIO v2.0 can be found in the associated publication.50
The 2020 state health expenditure data from the Centers for Medicare and Medicaid Services (CMS) are adjusted to reflect patients’ states of residence, reallocating spending from where care was provided to the patient’s home state to account for cross-border health care.51 This ensures that health expenditure data accurately represent the health care costs associated with each state’s residents, providing a clearer picture of health care spending based on population needs and behaviors.52
To estimate state-level greenhouse gas emissions for the health care sector, health expenditure categories were first mapped to corresponding economic sectors from the USEEIO model. Next, expenditure data were initially adjusted for inflation by converting from 2020 to 2012 dollars using the GDP price index — multiplied by a conversion factor (93.18/105.41). To adjust for differences in the carbon intensity of electricity consumed in each state, emissions from purchased electricity were adjusted using electricity emissions intensity data from eGRID.53
For each state, the percentage deviation from the U.S. average emissions intensity rate was applied to the emissions factors of the electric power generation, transmission, and distribution sector in the model. The updated D matrix, representing direct emissions coefficients, was then used to compute state-specific GHG factors. The equation, Nd = D x Ld, calculates state-specific total GHG emissions factors by combining direct emissions intensities (D) with the supply chain requirements (Ld) across sectors. The impact factors for GHG emissions were then multiplied by expenditures for each health care category to yield state-level GHG estimates.
Health Care Worker Commuting Emissions
The primary source used to derive this metric was the EPA’s Smart Location Calculator (SLC), a tool aimed at determining workplace location efficiency and examining the worker commuting emissions based on workplace location.54 Data from the Smart Location Calculator is disaggregated by census block group, the smallest statistical area for which the Census Bureau tabulates data. Vehicle Miles Traveled (VMT) values for each census block group are calculated using a combination of demographic and built environment factors. The main factors include income levels, gender, number of household drivers versus vehicles, gas prices, housing and job density, road network characteristics (automobile and pedestrian-oriented), and transit accessibility. The modeling process accounts for trips for a commuting purpose and those for a noncommute purpose (midday errands), which originate or end in the block groups in which the workplace is located.
First, the SLC data were joined with the TIGER files for census block group.55 VMT values were then averaged from block groups within a quarter-mile radius of the health care facility to account for facilities that fall along the boundary on a census block group and potentially share characteristics with the adjacent block group. To calculate GHG emissions associated with employee commuting at each facility, the VMT values were multiplied by the EPA’s most recent emissions factors for passenger cars and light-duty trucks.56 The Federal Highway Administration 2022 State Motor-Vehicle Registrations,57 showing the breakdown of automobiles and trucks by state, was used to determine the appropriate proportion of VMTs to multiply by each factor.
Calculations resulted in the mass of CO2, CH4, and N2O emitted per day from one worker’s commute. Using the EPA’s Global Warming Potential (GWP) values, the total amount of GHG emissions were calculated in terms of kg CO2e.58 Next, annual GHG emissions from a worker’s commute were calculated by multiplying the per-day emissions value by 260 days, the assumed days per year that a worker commutes, according to the EPA. To aggregate up to state level, we took the average of annual commute emissions per worker, based on the number of health care facilities in each state.
For more information, see the Appendix Tables.
Acknowledgements
The authors would like to sincerely thank the members of our advisory panel: John Balbus of HHS/Climate Care Consulting, Peter Berry of Health Canada, Joe Bialowitz of Memorial Sloan Kettering Cancer Center, Melissa Bilec of University of Pittsburgh, and Kara Brooks of the American Hospital Association.
We would also like to acknowledge the following Commonwealth Fund staff members: David Radley, Kristen Kolb, Sara Collins, and Lovisa Gustafson for supporting the development of the scorecard; Joseph Betancourt, Kathleen Regan, Tony Shih, Rachel Nuzum, Arnav Shah, and Evan Gumas for providing constructive feedback and guidance; and the Fund’s communications and support teams, including Barry Scholl, Chris Hollander, Bethanne Fox, Samantha Chase, Jen Wilson, Paul Frame, Josh Tallman, Naomi Leibowitz, Deborah Lorber, Aishu Balaji, Avni Gupta, Carson Richards, Celli Horstman, Mathew Kelley, Paige Huffman, Claire Coen, and Karina Polanco for their guidance, editorial and production support, and public dissemination efforts.
Finally, we wish to acknowledge Maya Brod and Gabrielle O’Brien of Burness for their assistance with media outreach.