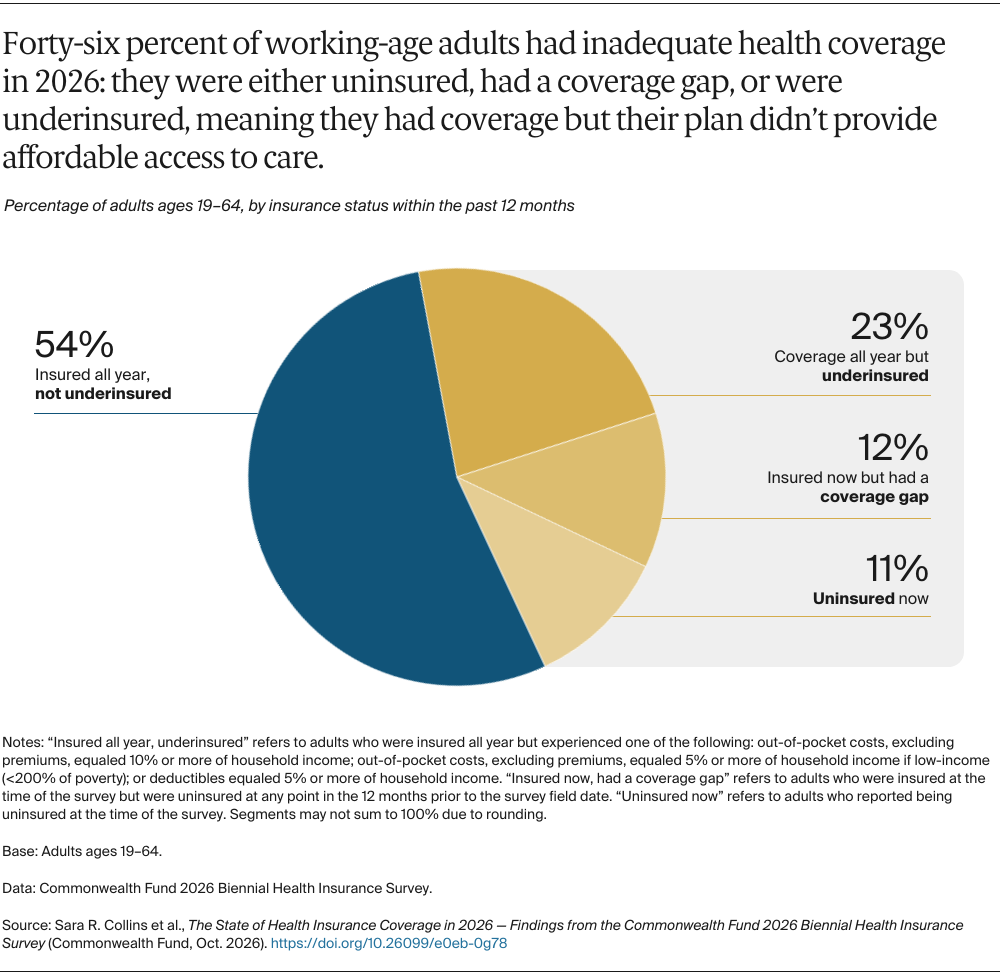
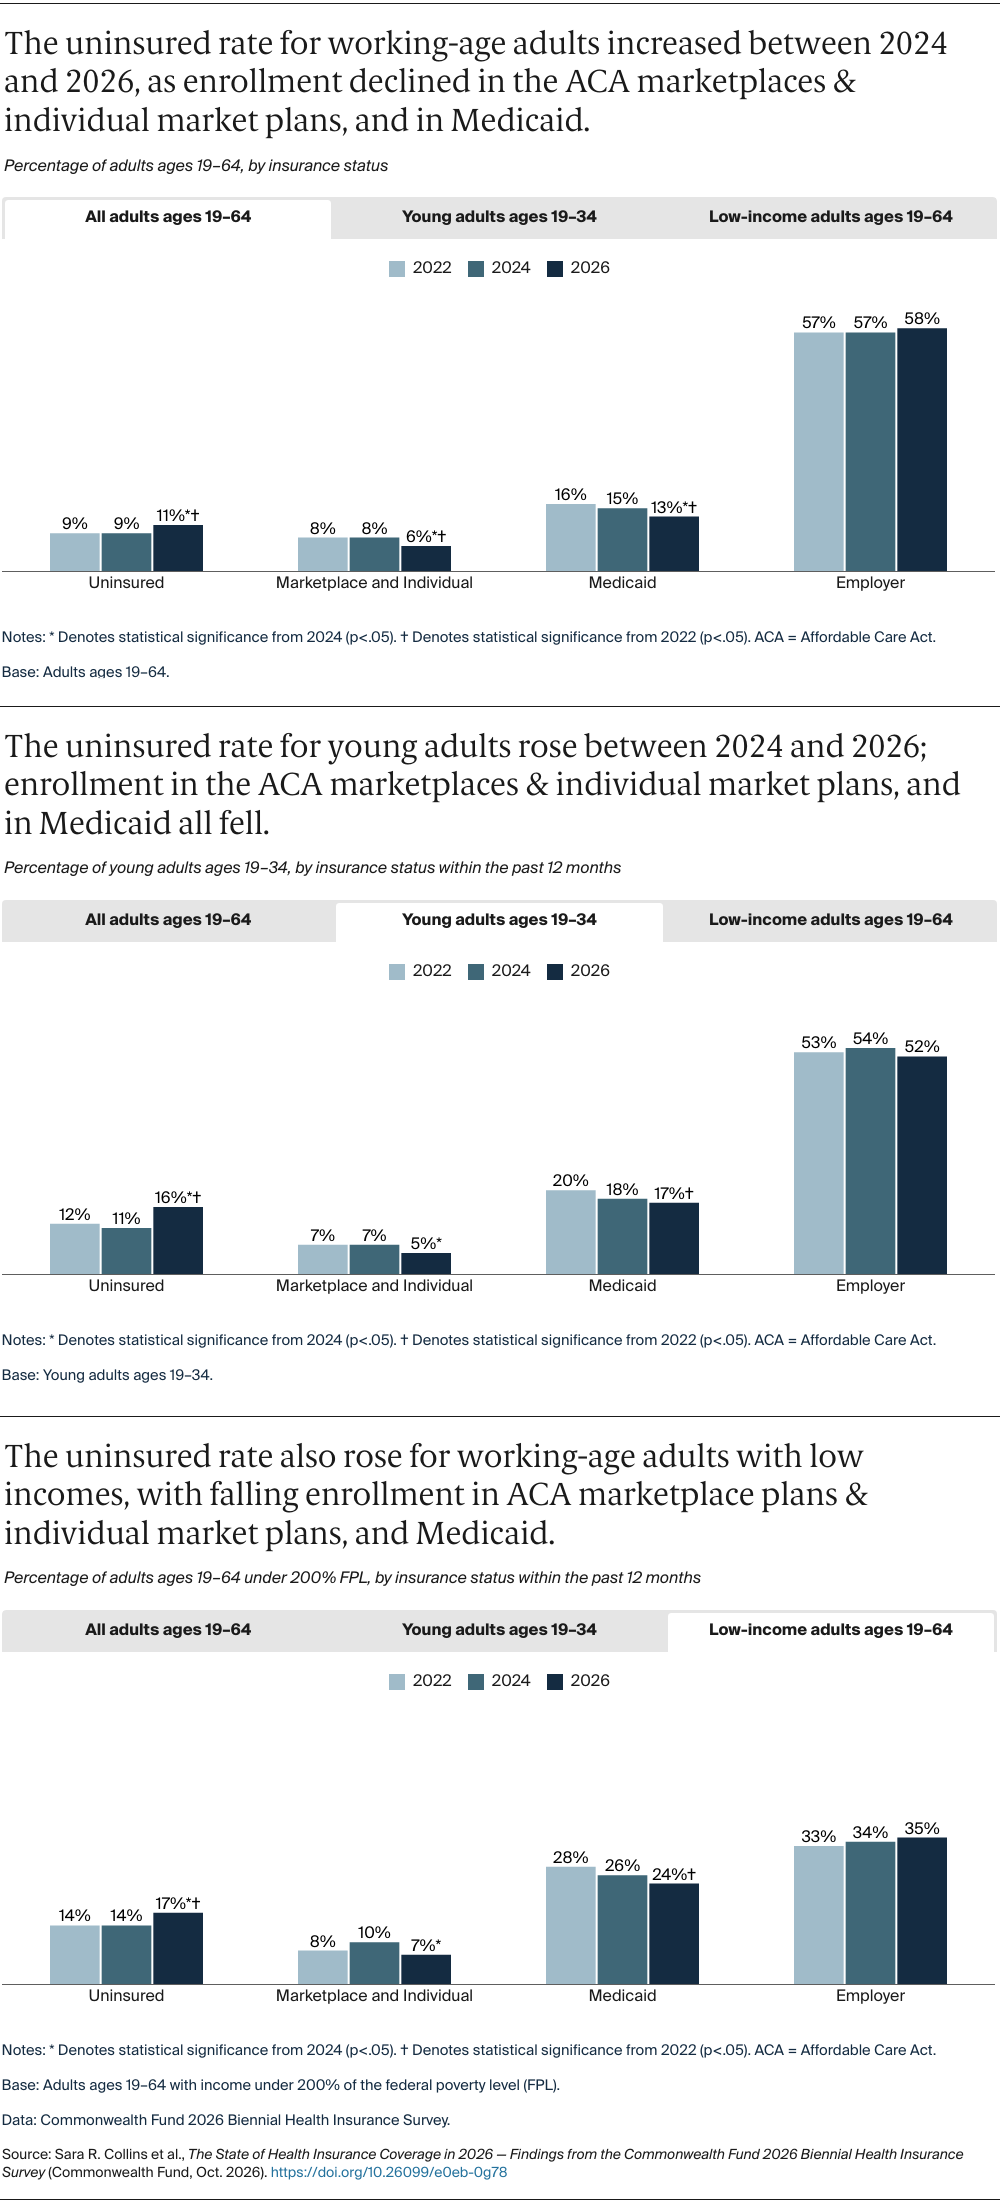
Recent federal policy actions already appear to be taking a toll on people’s health coverage — ahead of major Medicaid cuts and other changes that are likely to trigger coverage losses for millions of Americans starting in 2027. This withdrawal of support for people’s health care runs counter to how most people feel about the role of the federal government in ensuring coverage for all Americans.
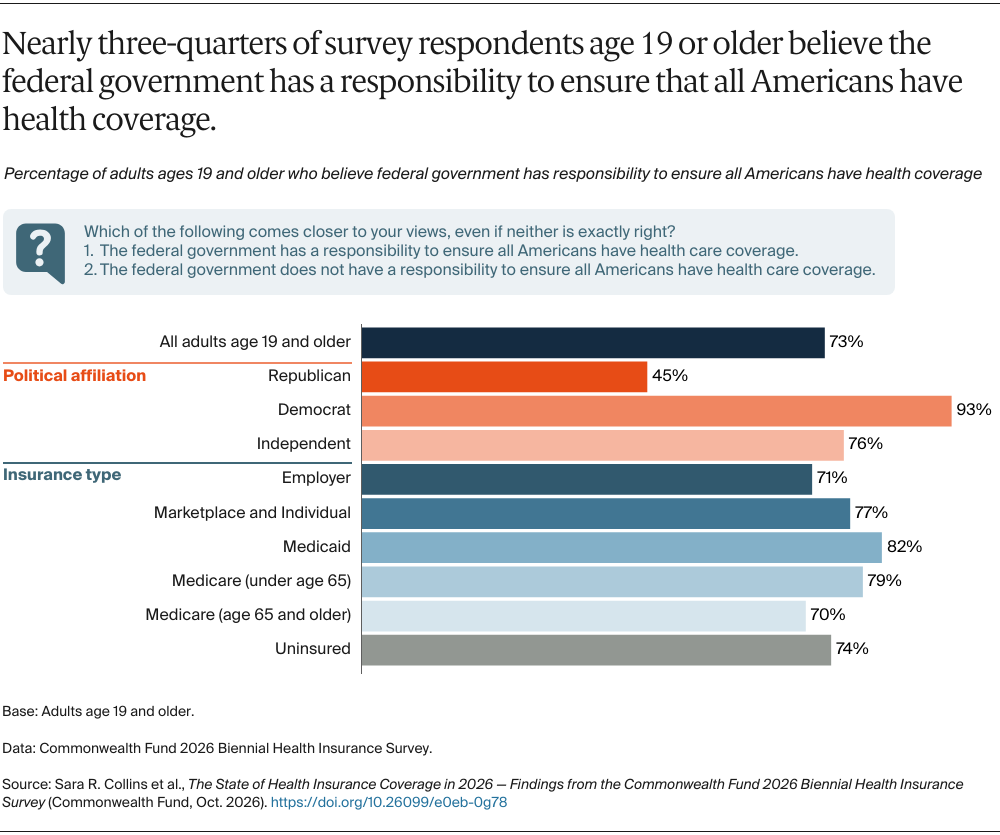
When we asked in the survey whether the federal government has a responsibility to ensure all Americans have health care coverage, nearly three-quarters of adults age 19 and older said it does. While Democrats (93%) and Independents (76%) held this view at the highest rates, close to half (45%) of Republicans also thought the federal government has this responsibility.
How Can We Ensure That All Americans Have Good Health Coverage?
The United States continues to spend the most on health care compared to other economically advanced nations. Yet it has the least to show for all that spending: the U.S. has lower life expectancy, higher infant and maternal mortality rates, large chronic disease burdens, and significant health disparities by socioeconomic class, geography, and race.
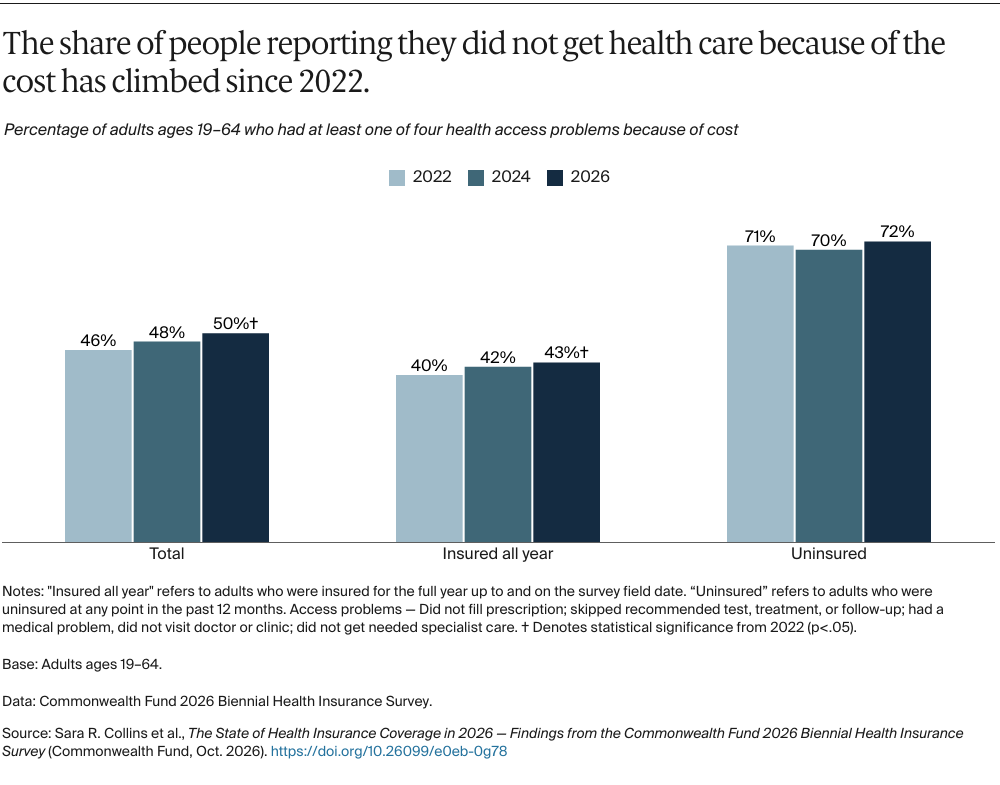
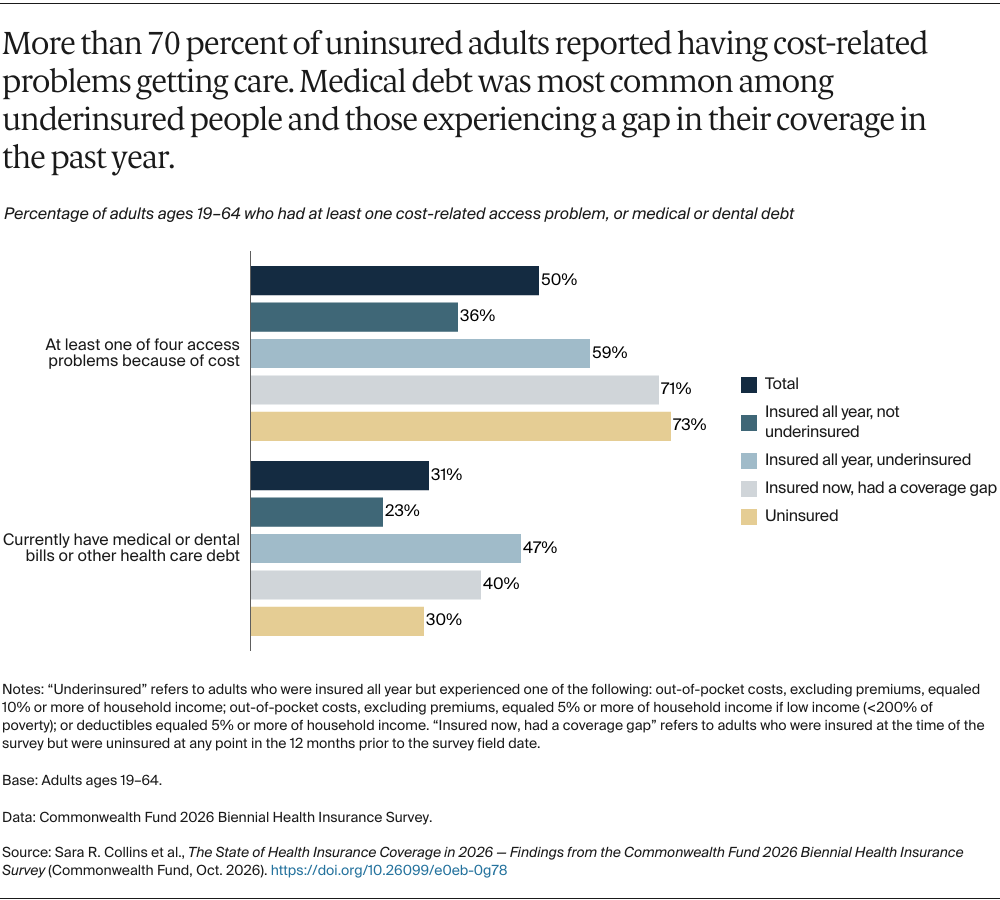
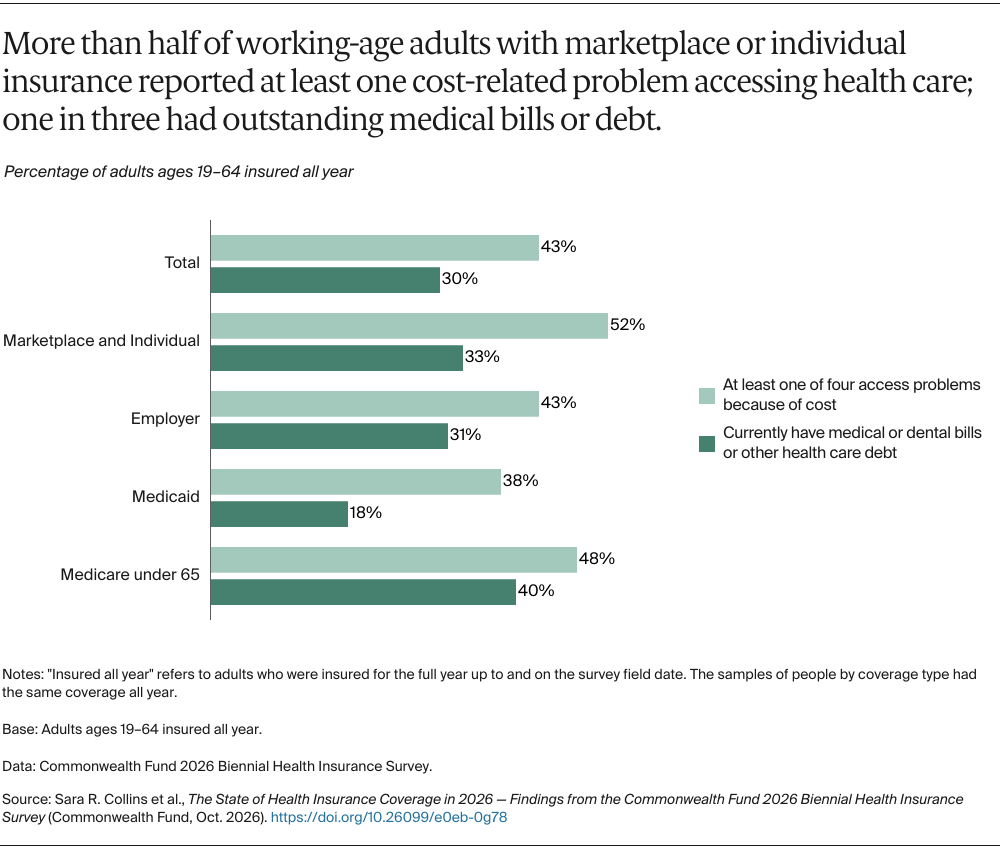
Unlike peer countries, the U.S. does not guarantee adequate health insurance for all its residents. Our survey findings show just how detrimental a lack of continuous coverage and high out-of-pocket costs are to people’s ability to afford care and maintain their health — without going into debt.
Now the nation stands on the brink of significant coverage losses that could push the number of uninsured people to 37 million by 2036. Historically high rates of growth in health costs will make premiums and care even less affordable. Together, this will likely translate to poorer health outcomes for many Americans.
Congress and the executive branch have the tools to address the escalating affordability and coverage problems facing Americans. They can ensure everyone has good, affordable health insurance and health care. The people we surveyed are signaling to policymakers that the federal government has a responsibility to do this. Here are several policy options to provide people with near-term relief, even as the politics of enacting more comprehensive health reform plans unfold over the next few years.
Cover More Americans and Keep Them Covered
Permanently extend the enhanced marketplace premium tax credits that expired in 2025. This would dramatically lower marketplace enrollees’ premium costs and help the estimated 3 million people who dropped coverage to reenroll. Reinstating the enhanced tax credits would also reduce premiums and offset federal tax credit expenditures.
Eliminate Medicaid work requirements. Most Medicaid enrollees who can work already do. The experience with Medicaid work requirements to date has shown that enrollment losses are largely driven by complex administrative and reporting requirements rather than employment status.
Create a longer period of continuous Medicaid eligibility. Disruptions in Medicaid coverage due to eligibility changes, administrative errors, and other factors can leave people uninsured and unable to get care. Congress could reverse H.R. 1’s mandatory six-month recertification requirements for adults covered by the Medicaid expansion and give states the option to maintain continuous enrollment eligibility for 12 months without the need to apply for a waiver.
Fill the Medicaid coverage gap. Congress could create a federal fallback option for Medicaid-eligible people in the 10 states that have yet to expand their program. One way is to expand marketplace eligibility to include people in the coverage gap. That could be coupled with an extension of the enhanced premium tax credits to ensure zero-premium plans and no cost sharing.
Create an autoenrollment mechanism. A substantial share of people who are uninsured in the U.S. are eligible for subsidized coverage through Medicaid, the ACA marketplaces, or employer-sponsored coverage. The CBO estimates that by 2036, more than 60 percent of uninsured people will be eligible for subsidized coverage but not enrolled in it. Through autoenrollment in comprehensive, affordable health coverage, the nation could move closer to universal coverage.
Improve Insurance Design and Protect Consumers from Medical Debt
Eliminate deductibles in commercial insurance plans and cap provider payment rates. Originally envisioned as incentives for consumers to shop for high-value care, deductibles have instead acted as a barrier to obtaining all care, including high-value services, and as a vector for medical debt. Deductibles have also enabled insurers, employers, and policymakers to lower premium costs by shifting costs to consumers.
To fix these counterproductive incentives and outcomes, Congress could change the marketplace benchmark plan (the plan which determines the size of tax credits people receive) from silver to a more cost-protective gold plan. It could also eliminate deductibles for those plans. Premium increases would be offset by requiring insurers to pay providers a percentage of Medicare rates. Similarly, Congress could set new standards for employer-sponsored plans that include no deductibles, and it could enable employers to cap hospital rates and the other provider prices that insurers pay.
Congress could pass legislation banning all medical debt from all credit reports. About 15 million people have medical bills on their credit reports, totaling an estimated $49 billion. They are the largest source of debt on credit reports. However, medical debt has been found to have little predictive value for credit underwriting purposes: people whose credit scores were hurt by medical debt are as likely to repay loans as those with higher credit scores.
The federal government and states could strengthen and enforce financial assistance requirements for hospitals. Financial assistance could protect people from medical debt after a hospital stay. But federal law requires only nonprofit hospitals to establish a written financial assistance policy, and it doesn’t specify any minimum eligibility requirements. Some states require hospitals to provide financial assistance with minimum eligibility standards, but the amount of assistance required varies widely, as does enforcement.
Lower health care cost growth. Relentless growth in the cost of health care is at the root of the nation’s affordability crisis. That growth is driven primarily by the provider and pharmaceutical prices that commercial insurers and employers pay. Ultimately, private payers will need to do a better job of leveraging their purchasing power to slow cost growth in commercial markets.
Many states have implemented policies to slow cost growth, including caps on hospital prices and price increases and insurance rate regulation. But over the long run, it may take comprehensive federal reform to cover all Americans and slow cost growth.
How We Conducted This Survey
The Commonwealth Fund 2026 Biennial Health Insurance Survey was based on an integration of stratified address-based sample (ABS) with SSRS Opinion Panel, and prepaid cell phone sample. This sampling design was first introduced for the 2022 Biennial Health Insurance Survey and was a shift from our historically exclusive use of phone administration via stratified random-digit dial (RDD) phone sample. We made refinements to how we calculate poverty status and measure underinsurance in 2024.
The 2026 Biennial Health Insurance Survey was conducted by SSRS from May 7 through July 20, 2026. The survey consisted of telephone and online interviews in English and Spanish and was conducted among a random, nationally representative sample of 9,360 adults age 19 and older living in the continental United States. A combination of address-based, SSRS Opinion Panel, and prepaid cell samples was used to reach people. In all, 43 percent or 4,023 interviews were conducted online or on the phone via ABS, 49 percent or 4,591 interviews were conducted online via the SSRS Opinion Panel, and 8 percent or 746 interviews were conducted on prepaid cell phones.
The sample was designed to generalize to the U.S. adult population and to allow separate analyses of responses from low-income households. Statistical results were weighted in stages to compensate for sample designs and patterns of nonresponse that might bias results. The first stage involved applying a base weight to account for different selection probabilities and response rates across sample strata. In addition to accounting for sampling probabilities, the base weights also include a compositing adjustment to account for the overlapping sample frames. In the second stage, sample demographics were poststratified to match population parameters.
The resulting weighted sample is representative of the approximately 259.9 million U.S. adults age 19 and older. The survey has an overall maximum margin of sampling error of +/– 1.3 percentage points at the 95 percent confidence level. As estimates get further from 50 percent, the margin of sampling error decreases. The ABS portion of the survey achieved a 12 percent response rate, the SSRS Opinion Panel portion achieved a 2.7 percent response rate, and the prepaid cell portion achieved a 1.7 percent response rate.
This brief focuses on 7,362 adults ages 19 to 64 for most analyses. The resulting weighted sample is representative of approximately 199.5 million U.S. adults ages 19 to 64. The survey sample has a margin of sampling error of +/– 1.5 percentage points at the 95 percent confidence level for this age group.
This brief also includes data from the 2024 and 2022 Commonwealth Fund Biennial Health Insurance Surveys. The 2024 Biennial Survey was conducted by SSRS from March 18 through June 24, 2024, using the same sampling frame as in 2026; this resulted in a sample of 6,480 adults ages 19–64, with a margin of sampling error of +/– 1.7 percentage points at the 95 percent confidence level for this age group.
The 2022 Biennial Survey was conducted by SSRS from March 28 and July 4, 2022, using the same sampling frame that resulted in a sample of 6,301 adults ages 19–64, with a margin of sampling error of +/– 1.7 percentage points at the 95 percent confidence level for this age group.
Appendix A. Who Is Underinsured?
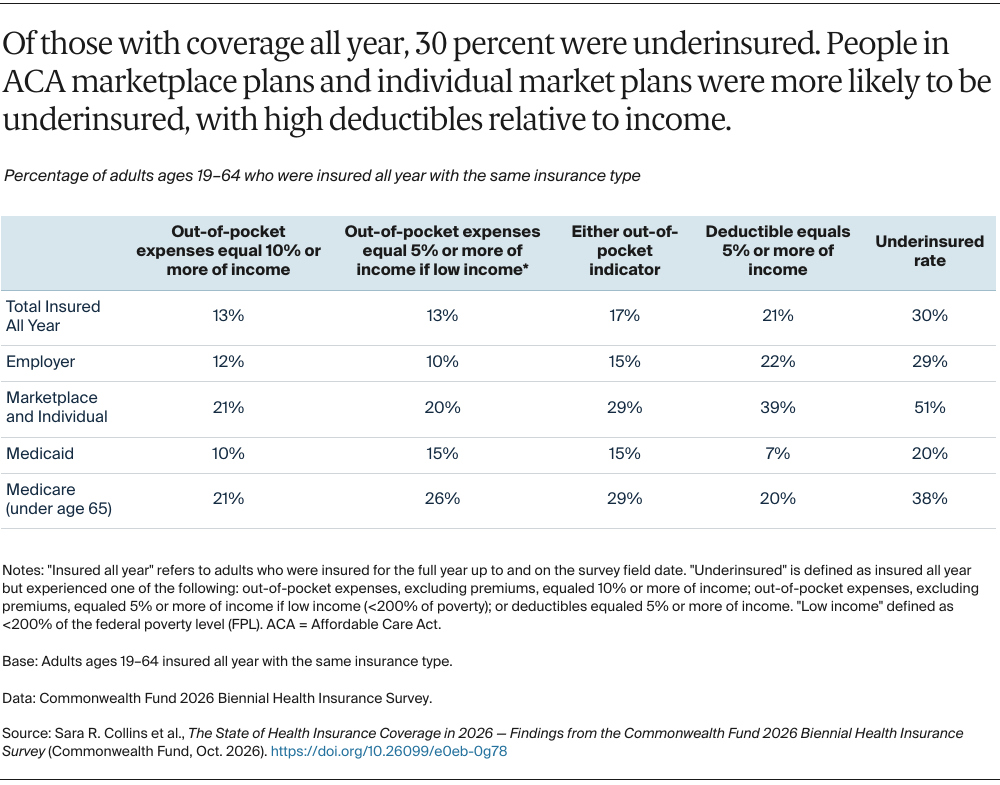
For our analysis, people who are insured all year are considered to be underinsured if their coverage doesn’t enable affordable access to health care. That means at least one of the following statements applies:
- Out-of-pocket costs over the prior 12 months, excluding premiums, were equal to 10 percent or more of household income.
- Out-of-pocket costs over the prior 12 months, excluding premiums, were equal to 5 percent or more of household income for individuals living under 200 percent of the federal poverty level ($31,300 for an individual or $64,300 for a family of four in 2025).
- The individual or family deductible constituted 5 percent or more of household income.
Because out-of-pocket costs occur only if a person uses their insurance to obtain health care, we also consider the deductible when determining whether someone is underinsured. The deductible is an indicator of the financial protection that a health plan offers as well as the risk of incurring costs before a person gets health care. We do not, however, consider the risk of incurring high costs owing to an insurance plan’s other design features, such as out-of-pocket maximums, copayments, or uncovered services, since we do not ask about these features in the survey.
Appendix B. Estimates of U.S. Uninsured Rates
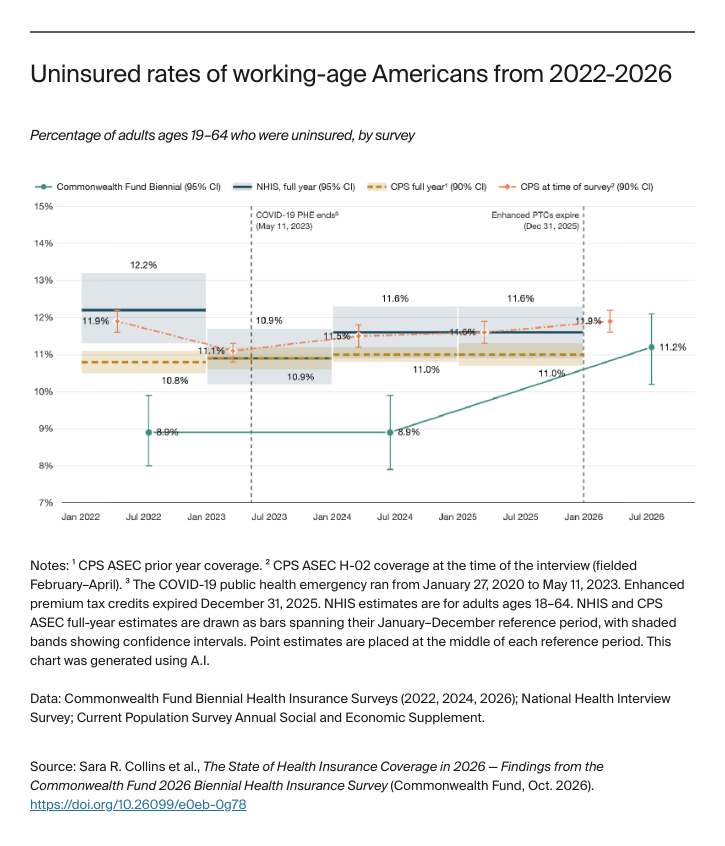
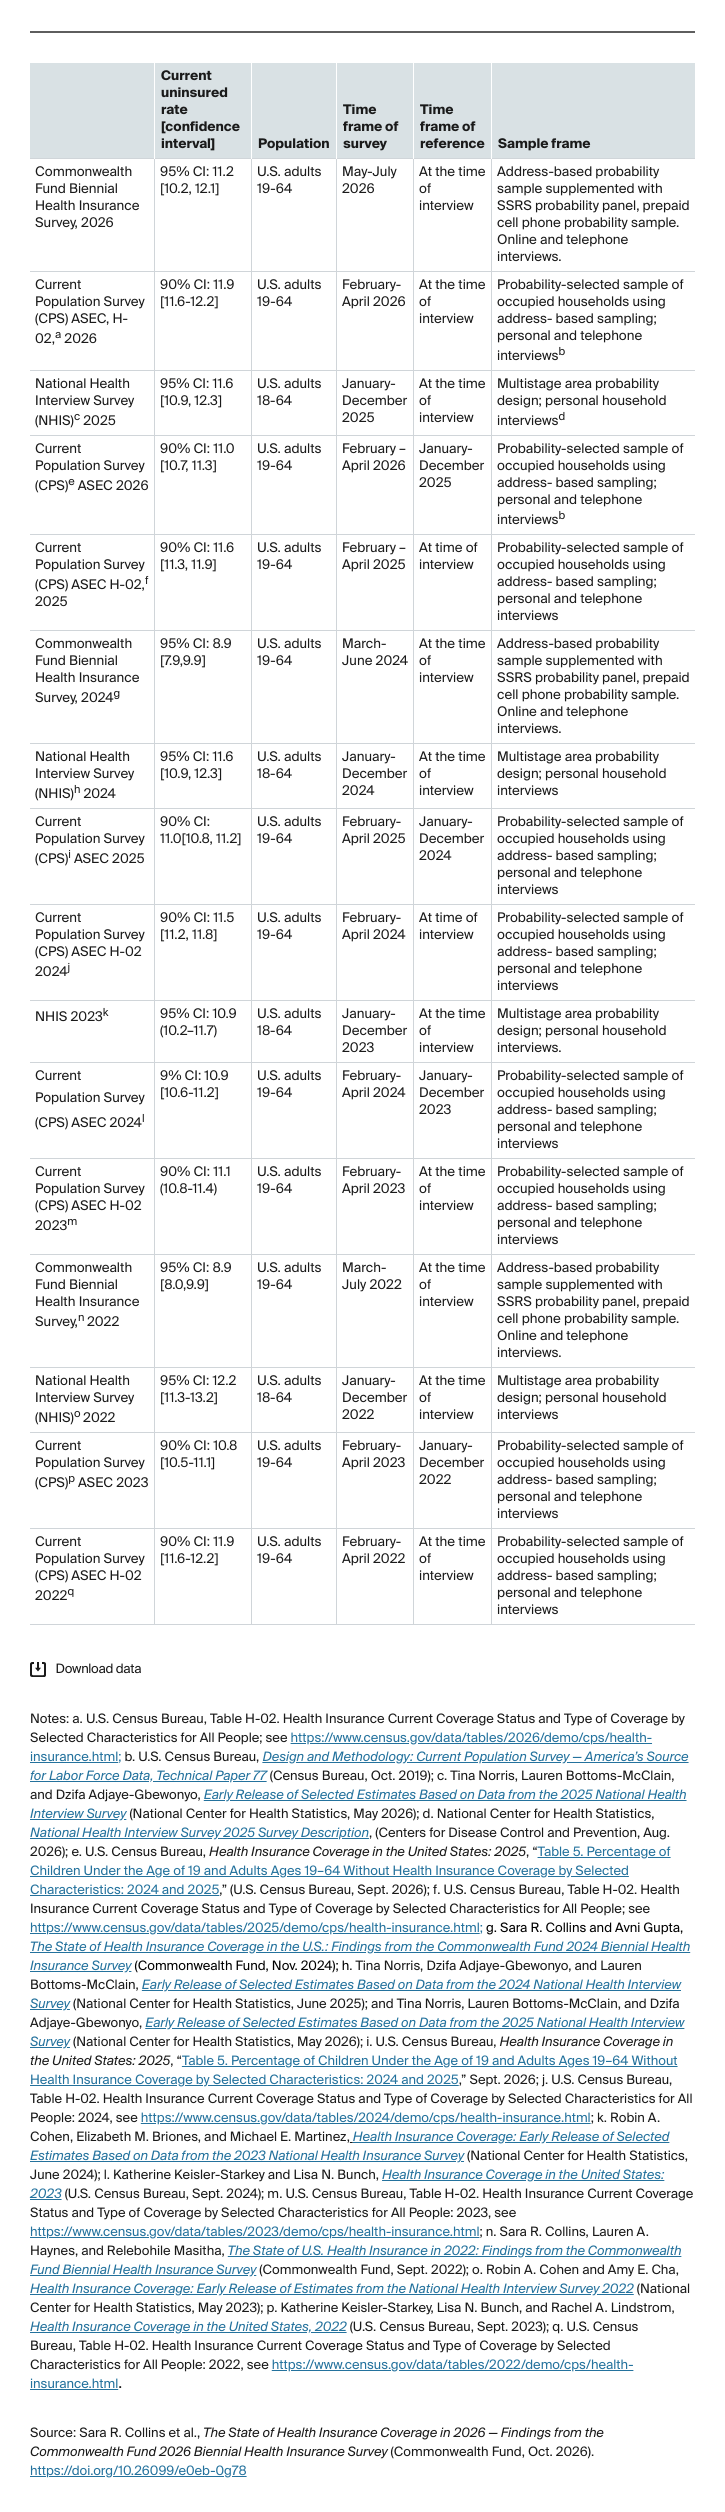
Uninsured estimates from the Commonwealth Fund Biennial Health Insurance Survey have, over time, been consistently lower than those of the two major federal surveys that measure insurance coverage: the Centers for Disease Control and Prevention’s National Health Interview Survey (NHIS) and the Current Population Survey. (Data for all of 2026 will not be available from either survey until 2027.) In the future, Biennial Health Insurance Survey estimates will likely continue to be lower due to differences in sampling frame and mode (see table below), the way in which the insurance coverage questions are asked, and other factors.
However, the Commonwealth Fund survey has tracked directional trends in the uninsured, as the chart and table below show. Our survey provides an early indication that the federal surveys may show an uptick for 2026 as well.