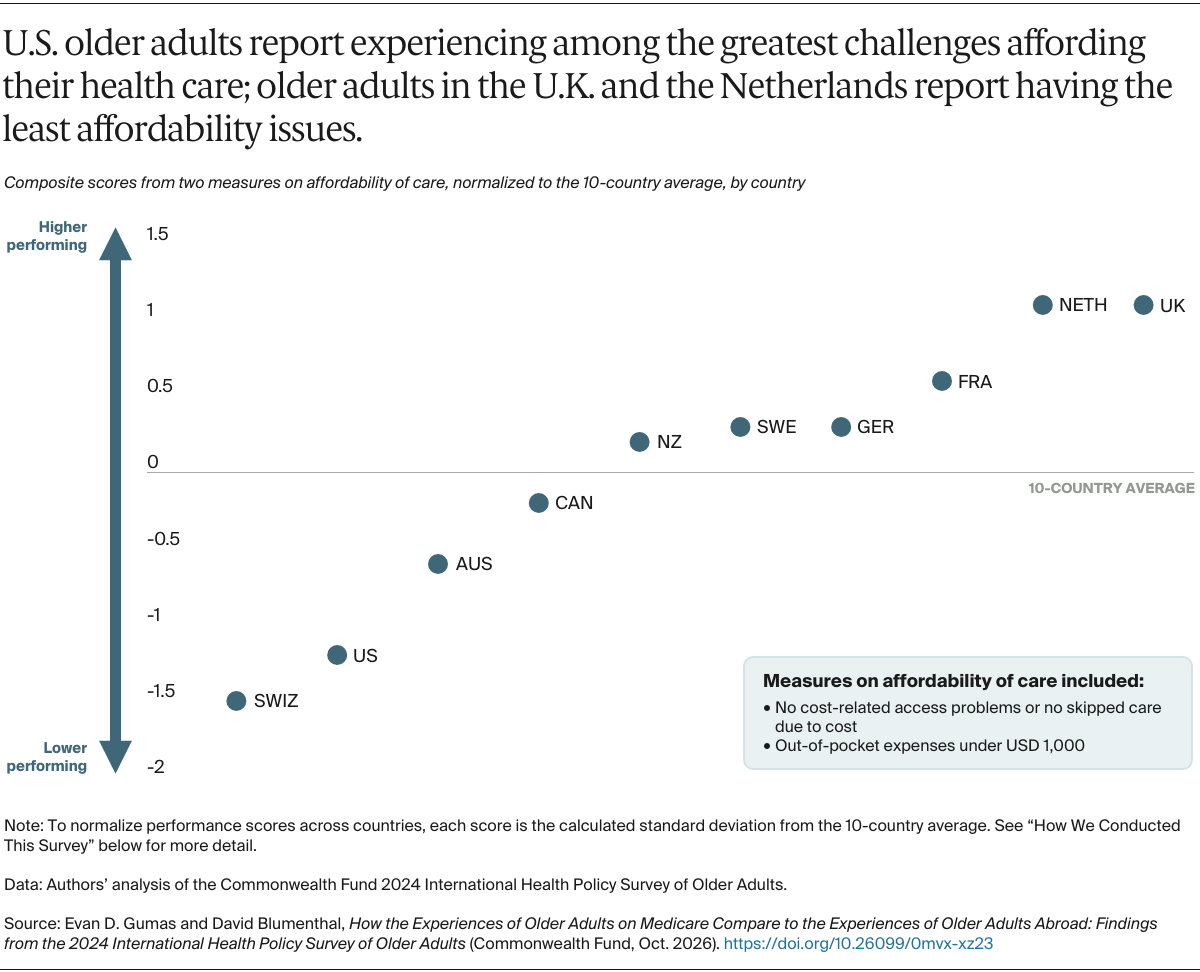
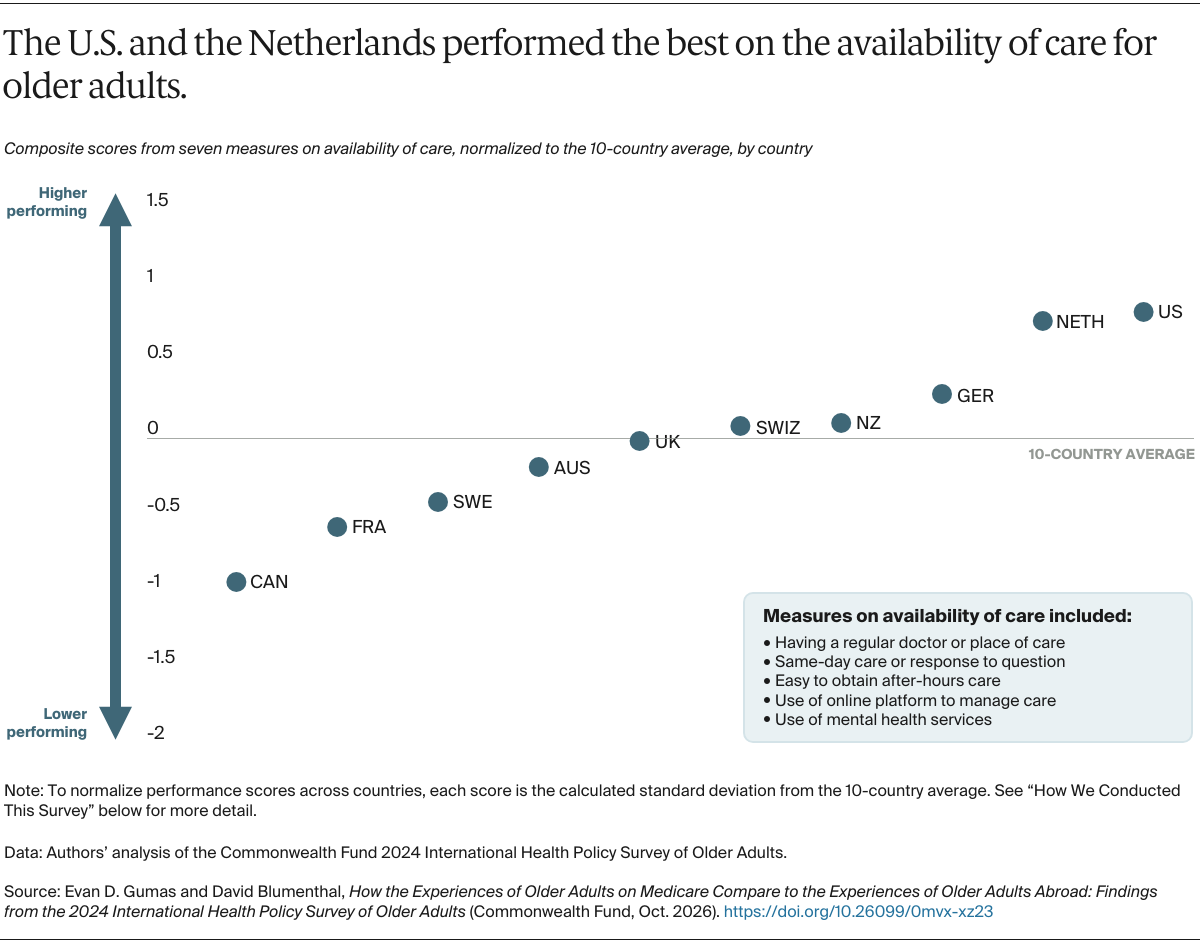
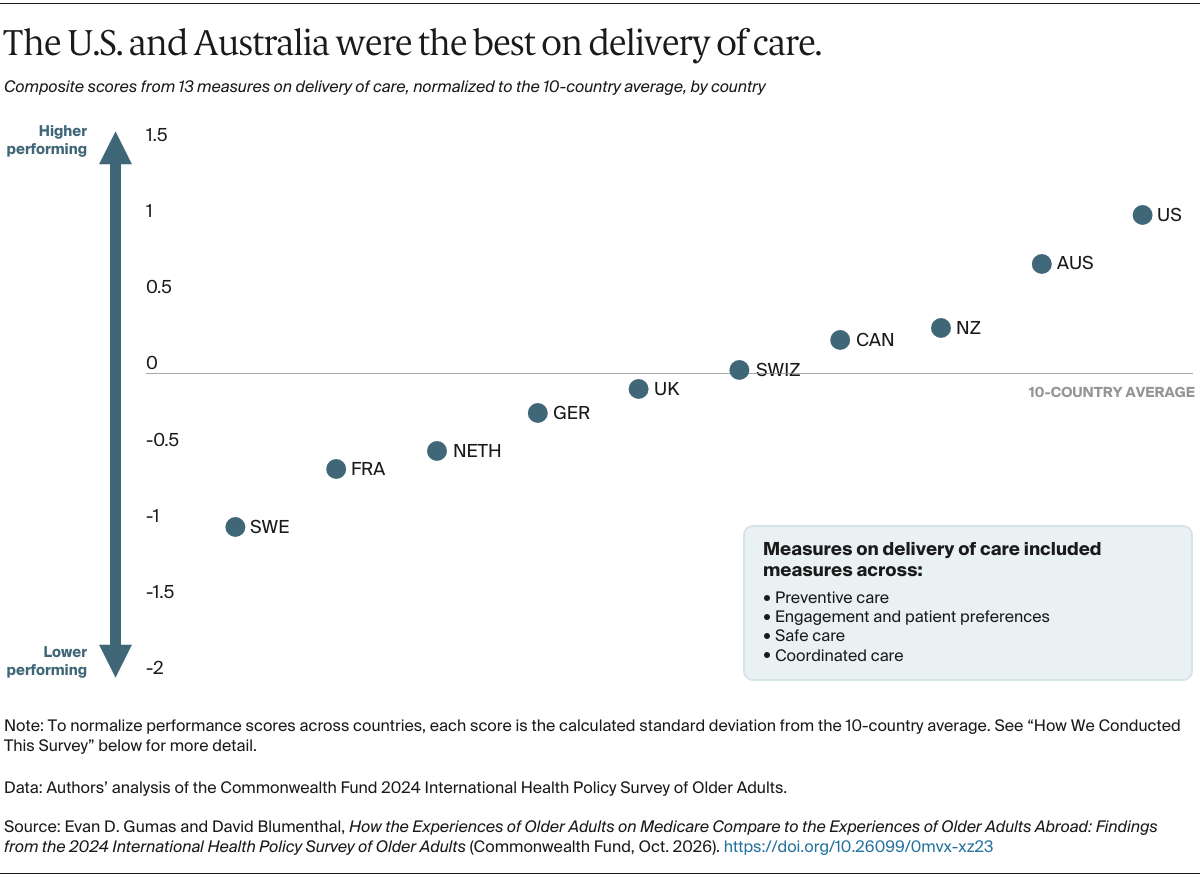
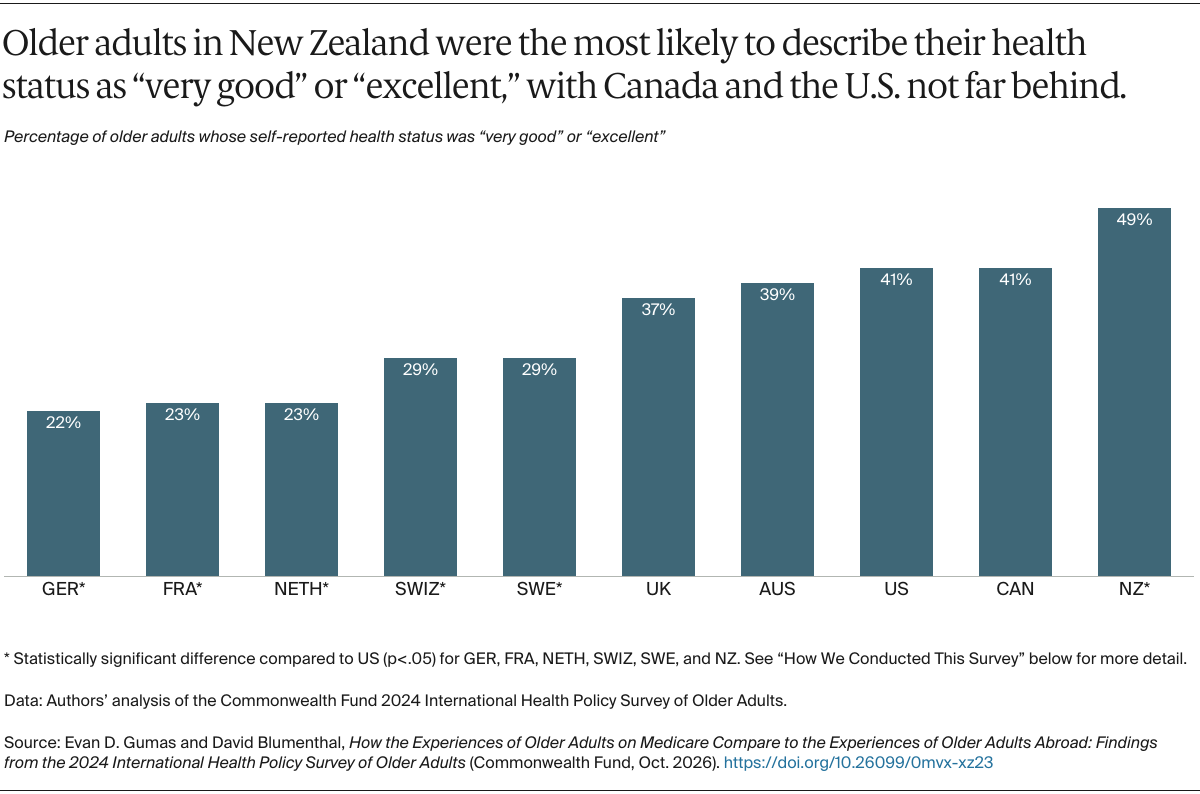
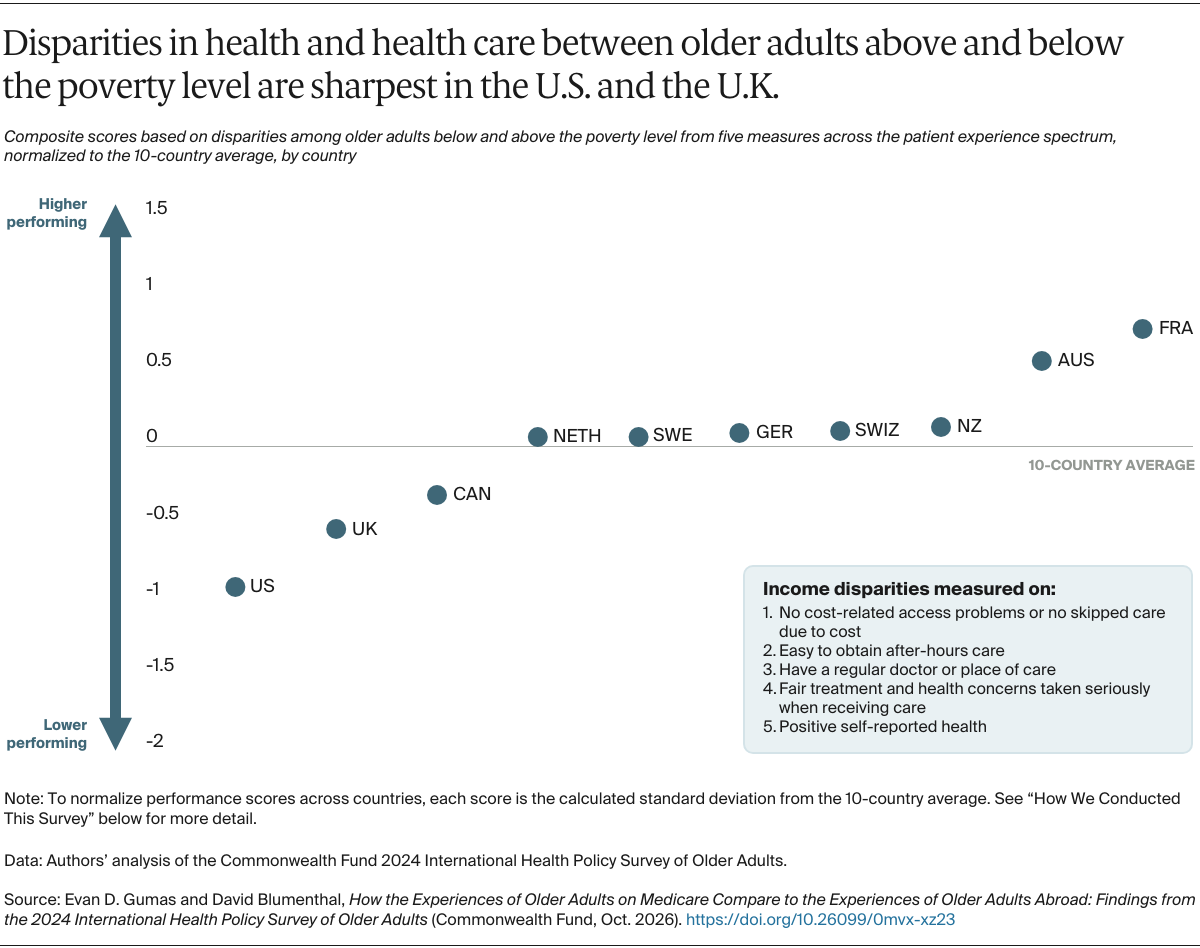
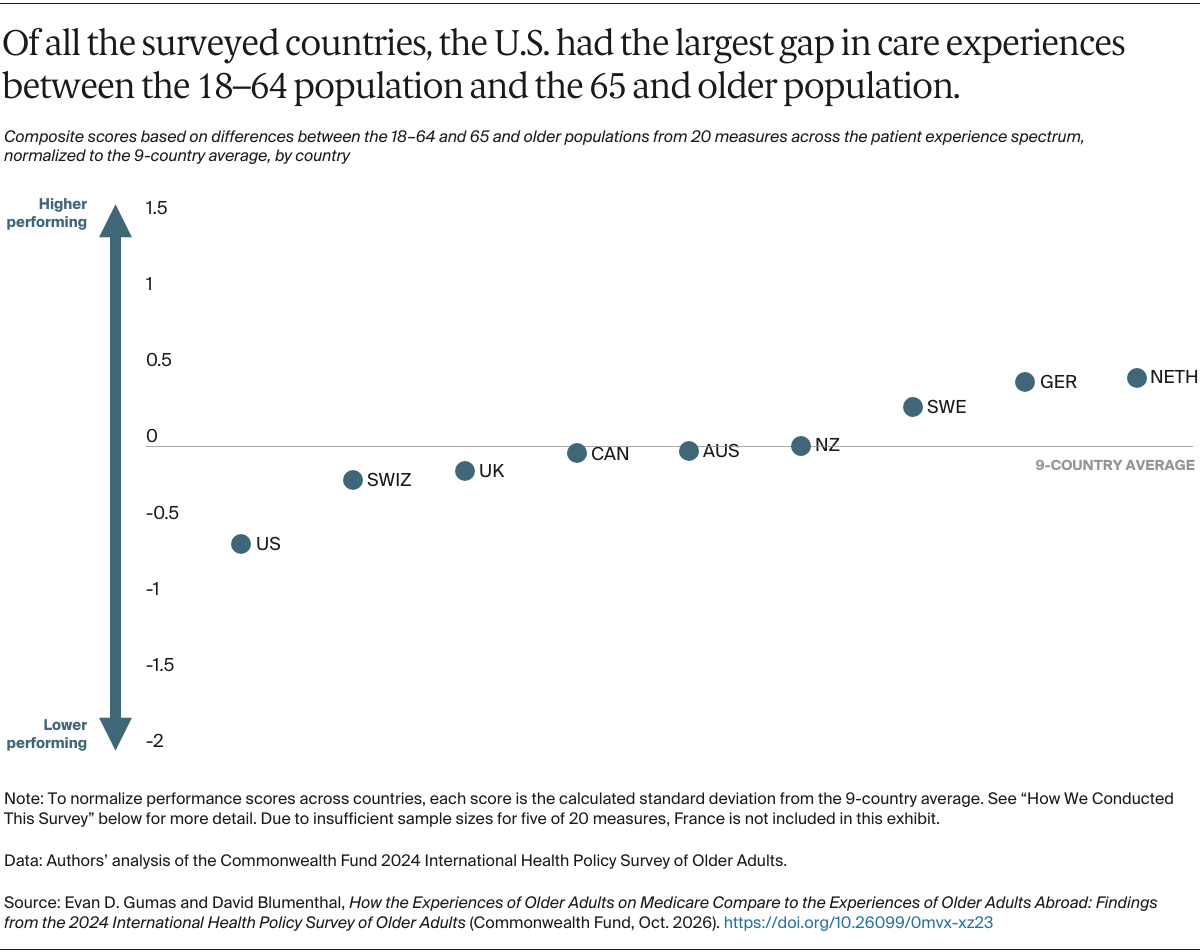
This analysis adapts the methodological approach used in the Commonwealth Fund’s Mirror, Mirror reports, applying it specifically to adults age 65 and older using selected measures from the Commonwealth Fund 2024 International Health Policy Survey of Older Adults. Mirror, Mirror relies on survey measures from older adults, the general population (ages 18 to 64), public databases such as the Organisation for Economic Co-operation and Development (OECD) and the World Health Organization (WHO), and the published literature. This analysis, however, relies entirely on patient-reported measures from older adults and the general population to assess health system performance.
Data
Sample and Interview Design
Survey data are drawn from the Commonwealth Fund International Health Policy Survey of Older Adults (adults age 65 and older) fielded in 2024 in 10 countries. Conducted from February 29 to June 20, 2024, the survey was administered to a nationally representative sample of adults age 65 and older (n=16,737) in Australia, Canada, France, Germany, the Netherlands, New Zealand, Sweden, Switzerland, the United Kingdom, and the United States.
Commonwealth Fund 2024 International Health Policy Survey
Sample Size by Country (n)
| AUS | CAN | FRA | GER | NETH | NZ | SWE | SWIZ | UK | US |
| 501 | 3,989 | 300 | 2,008 | 601 | 500 | 2,707 | 2,634 | 1,551 | 1,946 |
The Commonwealth Fund contracted with SSRS, a U.S.-based survey research firm, to field the survey in the U.S. and six additional countries, and to collaborate with fieldwork partners and oversee survey administration in the other three countries. Final country sample sizes ranged from 300 to 3,989. Interviews were conducted via landline, mobile, or online administration. For this analysis, U.S. respondents were limited to those with Medicare coverage. Respondents who reported they were dually eligible for Medicare and Medicaid were classified as “Medicare Advantage” if they reported they had a Medicare Advantage plan or “traditional Medicare” if they did not report a Medicare Advantage plan. The sample of U.S. respondents used in this analysis was 1,882 (traditional Medicare = 845; Medicare Advantage = 1,037).
In Australia, Canada, France, Germany, the Netherlands, and New Zealand, a random-digit dial (RDD) overlapping-frame telephone design was used to obtain all interviews. A large share of the interviews in both the U.K. and the U.S. was also obtained using an overlapping-frame telephone design. The sample design in both the U.K. and the U.S. also included interviews via Verian’s Public Voice Panel and the SSRS Opinion Panel, respectively. In the U.S., the SSRS Opinion Panel sample was used to target subgroups of analytical interest to the Fund, namely low-income, Black, Hispanic, and rural respondents. Sweden and Switzerland both used population-based registries to draw their sample. Additional country-specific information on the sampling frames is provided below:
- For Australia and New Zealand, SSRS procured landline and cell phone RDD samples from its sampling partner, Sample Solutions. For Australia, the landline RDD frame was based on phone number blocks in the Australian telephone numbering plan, and eight regions were used to stratify the landline RDD sample to ensure geographic representativeness. The selection of the cell phone RDD sample in Australia used a roughly similar approach to the landline sample, though geographic information was not available for this frame. The shares of each cell phone service provider across the entire market were balanced to ensure all providers were properly represented in the cell phone RDD sample. For New Zealand, the landline RDD sample was based on Telecom New Zealand’s numbering plan and stratified by New Zealand’s 16 regions plus the Chatham Islands, while the cell phone RDD sample was essentially the same as Australia’s.
- Dynata, a global provider of sampling solutions, provided RDD landline and cell phone samples for Canada. The landline sample was drawn from Dynata’s database by geography after extensive cleaning and validation. The cell phone sample was drawn from the most recent monthly Telcordia TPM (Terminating Point Master) Data file, sorted by province, carrier name, and 1,000-block, to provide stratification that would yield a representative sample, both geographically and across large and small carriers.
- Sample Solutions provided the landline and cell phone RDD samples for France, the Netherlands, and the United Kingdom. The landline RDD frame for France was generated using the national numbering plan issued by L’Autorité de Régulation des Communications Électroniques et des Postes, an independent French agency responsible for regulating telecommunications. The landline RDD frame for the Netherlands was generated using the national numbering plan provided by the Ministry of Economic Affairs. The landline RDD frame for the U.K. was generated based on the phone number blocks used in the national telephone numbering plan, provided by the Office of Communications (OFCOM), London, using precodes by region. Based on the country-specific numbering plan, Sample Solutions stratified the landline RDD samples by official NUTS2 regions, reflecting each country’s population distribution. For the cell phone RDD samples, phone numbers were randomly generated, as in the landline RDD sample, for each country. Since it is not possible to identify providers by region on cell phones in France, the Netherlands, or the U.K., Sample Solutions identified providers used for residential services and excluded those used for commercial services. Online interviews in the U.K. were completed via Verian’s Public Voice Panel, a probabilistic panel recruited via address-based online surveying and face-to-face interviews. Both recruitment protocols use probability sampling to ensure the entire U.K. population is represented.
- The sample for Germany was sourced from the ADM sampling system (Arbeitsgemeinschaft ADM-Telefonstichproben). The ADM master sample is based on the range of numbers available in the German telephone network, as updated, monitored, and published by the Federal Network Agency (the government agency responsible for the German telephone network). Since about 99 percent of the population can be reached via at least one telephone number, the ADM system provides near-full coverage of the German population.
- The sample frame for Sweden used the Total Population Registry (RTB). The RTB includes more than 2.1 million adults age 65 and older and covers 99 percent of the Swedish population. To create the sample frame, personal identification numbers were matched to addresses so that invitations to participate in the survey could be sent to respondents selected from the sample. Four variables were used to stratify the sample frame into 36 strata: degree of urbanization (three groups), Swedish/foreign background (two groups), level of education (three groups), and age (two groups). Proportional allocation was generally used, except for one stratum that oversampled individuals age 80 or older with postsecondary education who were born outside Sweden and reside in sparsely populated areas.
- In Switzerland, the Swiss Federal Statistical Office (SFSO) drew a sample of individuals age 65 and older from the nationwide population registry. This registry covers nearly 100 percent of the Swiss population and is updated quarterly. The sample was stratified by the three linguistic regions: German-, French-, and Italian-speaking. The cantons of Zürich, Schaffhausen, Valais, and Basel Stadt were oversampled and treated separately as strata, for a total of seven.
- Three different sample frames were used for data collection in the United States — landline RDD, cell phone RDD, and the SSRS Opinion Panel — to maximize the number of interviews among subgroups of analytical interest. The landline and cell phone RDD frames were generated by Marketing Systems Group (MSG), with the cell phone RDD sample being prepared using the Advanced Cellular Frame (ACF). Both the landline and cell phone RDD samples were disproportionately stratified, based on flagging records on both RDD frames with appended data. The landline RDD sample was matched against Neustar’s Pure Consumer Premium Database to identify phone numbers more likely to be assigned to households with residents age 65 and older. The cell phone RDD sample included an ACF flag that identified phone numbers more likely to belong to individuals age 65 and older. The strata containing phone numbers flagged across both RDD samples were oversampled. To reach sufficient sample sizes among subgroups of analytical interest — including Black and Hispanic adults — as well as to target adults ages 65 to 74 and males age 65 and older, online interviews in the U.S. were completed via the SSRS Opinion Panel. SSRS Opinion Panelists are recruited randomly based on a nationally representative ABS (address-based sample) probability design (including Hawaii and Alaska), yielding a nationally representative panel of U.S. adults age 18 and older.
Questionnaire and Fielding
A common questionnaire was developed, translated, and adapted, with country-specific wording adjusted as needed. Interviewers in each country were trained to conduct interviews using a standardized protocol. Response rates varied from 3 percent in the United States to 50 percent in Switzerland.
Funding Partners
The Commonwealth Fund provides core funding for the survey, while cofunding and/or technical assistance are provided by the following country partners: the Canadian Institute for Health Information (CIHI); Commissaire à la santé et au bien-être du Québec (CSBE); Ministère de la Santé et des Services sociaux (MSSS); Ontario Health; German Ministry of Health and the Robert Koch Institute (RKI); Stichting Radboud universitair medisch centrum (Radboud University Medical Center); the Swedish Agency for Health and Care Services Analysis (Vård- och omsorgsanalys); the Swiss Federal Office of Public Health (FOPH); and The Health Foundation.
Weighting and Margin of Error
Data were weighted to ensure the sample was representative of the adult population age 65 and older in each country. Weighting procedures considered sample design, probability of selection, and systematic nonresponse across known geographic and demographic parameters, including region, sex, age, education, and other characteristics relevant to the population of each country. In the U.S., the calibration variables also included race and ethnicity.
The margin of sampling error for the Commonwealth Fund 2024 International Health Policy Survey of Older Adults ranged from +/– 2.3 percentage points for Canada’s sample to +/– 7.1 percentage points for France’s sample, all at the 95 percent confidence level.
Analysis
This analysis was informed by methods previously established in the Commonwealth Fund’s Mirror, Mirror series and adapted for the population age 65 and older. Based on available measures from the Commonwealth Fund 2024 International Health Policy Survey of Older Adults across 10 countries, we constructed domains aligned with those used in Mirror, Mirror, but tailored to the older adult population.
The analysis includes 49 total measures:
- 23 unique measures across:
- Affordability of Care (2 measures)
- Availability of Care (7 measures)
- Care Process (13 measures)
- Health Status (1 measure)
- 5 additional measures drawn from these indicators to assess income-related disparities
- 20 additional measures to assess differences between the 18 to 64 and the 65 and older age groups.
Measures assessing differences between the 18 to 64 and the 65 and older populations were only included if the same question existed in both the 2023 and 2024 international surveys.
The primary unit of analysis was the country-level estimate for each measure. Measures were oriented so that higher values consistently reflected better performance before standardization and aggregation.
Subgroup Differences
For subgroup differences, income was examined within each country. Responses for each measure were cross-tabulated by income below the poverty level and above the poverty level.
Differences between the two groups were calculated by subtracting one subgroup estimate from the other. These differences were then used to assess the magnitude of disparities within countries and within U.S. systems (see “Sensitivity Analysis: U.S. System Comparisons”).
Statistical Testing
Statistical significance testing was conducted at the indicator level in Stata 18 using survey-adjusted methods that account for complex survey design, including weights, clustering, and stratification. Differences between other countries and the U.S. were assessed using survey-adjusted contingency table analyses with adjusted Wald tests.
Normalized Indicators
For each measure, country results (e.g., the percentage of survey respondents giving a certain response) were converted into measure-specific standardized performance scores, referred to as normalized indicators. For each measure, normalized indicators were calculated as:
- the difference between the country result and the 10-country mean
- divided by the standard deviation of country results for that measure.
Normalization enables comparison across measures that differ in scale. A positive normalized indicator indicates performance above the 10-country average; a negative value indicates performance below average. The normalized scoring approach assumes that results are normally distributed.
For subgroup differences, absolute differences between raw values were used as the base measure. Absolute differences were then normalized.
Domain Performance Scores and Ranking
For Exhibits 1, 2, 3, 5, and 6, domain performance scores were calculated for each country by averaging the normalized indicators within each domain. Indicators within domains were equally weighted. For Exhibit 4, which presents a single measure, normalized domain averages were not calculated; instead, weighted survey estimates were presented directly.
Sensitivity Analysis: U.S. System Comparisons
As an additional sensitivity analysis, results for U.S. respondents were examined separately by traditional Medicare (TM) and Medicare Advantage (MA) to assess whether system-level differences influenced observed patterns.
For background, Medicare beneficiaries can choose to receive their benefits through either traditional (original) Medicare or an MA plan. TM consists of Parts A and B, which cover services such as hospitalizations, doctor visits, tests, and treatments. People can enroll in separate plans for prescription drug coverage (Part D) as well as other supplemental coverage to assist with out-of-pocket payments (Medigap). MA plans are Medicare-approved private health insurance plans that the federal government pays for, enabling them to provide Medicare-covered benefits. As of May 2026, just over half (51.2%) of all Medicare beneficiaries were enrolled in an MA plan.
Overall, TM and MA beneficiaries reported broadly similar experiences across domains. Where statistically significant differences were observed, the magnitude of those differences was generally small.
Access to Care
Of the nine access measures, differences between TM and MA beneficiaries were significant for one measure: the share reporting they had a regular doctor or place of care. Despite the difference (p < 0.05), the gap was small in magnitude (96% vs. 99%), and not substantively meaningful.
Care Process
Of the 13 care process measures, two showed significant differences:
- Respondents with a chronic condition reporting seeing a health care professional to manage their conditions: there was a significant difference (p < 0.05) between TM (77%) and MA (82%) beneficiaries, but the difference is not particularly meaningful, and the rates for TM and MA beneficiaries overall are the highest of any country in this analysis for that measure, except Australia at 80 percent.
- Respondents taking two or more prescription medications reporting that a health care professional reviewed their medications in the past year: there was a significant difference (p < 0.05) between TM (89%) and MA (93%) beneficiaries, but the difference was not meaningful, particularly as these rates are higher than any other country in this analysis.
Health Status
There was no significant difference in self-reported health status between TM and MA beneficiaries.
Differences by Income
Of the five measures in the income-related disparities section, differences between TM and MA beneficiaries were not significant for any measures.
Limitations
This report has several limitations. Some are specific to our analysis, while others are inherent to any cross-country comparative analysis.
First, no international comparative analysis can address every aspect of a complex health care system, nor can it account for nuances in cultural contexts that may yield varying responses across countries. For this analysis, there are limited, regularly updated cross-national data on the population age 65 and older.
Another notable limitation of this analysis is that it is descriptive and does not establish causal relationships. While statistical significance testing was conducted at the indicator level, domain- and subdomain-level statistical significance was not calculated.
The construction of domain scores also requires methodological choices regarding indicator selection and weighting. Indicators within domains were weighted equally to avoid implicitly privileging measures based on data availability. Alternative weighting schemes could yield different domain rankings. In addition, the number of indicators varied across domains and subdomains, potentially influencing the stability and sensitivity of domain scores.
As noted, this analysis relies on self-reported experiences, which may be subject to recall bias, response bias, and differences in expectations or health-seeking behaviors in the included countries. Despite weighting responses, low response rates in some countries may introduce nonresponse bias. This analysis also does not account for the roughly 10 million Medicare beneficiaries in the U.S. who are under age 65.
Subgroup differences are limited to the patient perspective by age and income level; however, these subgroups are not exhaustive and may mask variations within them, including differences related to race, ethnicity, or geography.
This analysis also compares the 18 to 64 population using 2023 survey data with the 2024 data used for the 65 and older population. Medicare beneficiaries under 65 were excluded from the analysis that used 2023 survey data. For more details on the 2023 survey methodology, see Mirror, Mirror 2024’s “How We Conducted This Study.”