Maternal and Child Mortality: How Do U.S. States Compare Internationally?
Midwife Cassandra Burrell examines pregnant patient Mia Mack at the Community of Hope Conway Health and Resource Center in Washington, D.C. Community-led and community-based organizations can not only provide patient-centered, holistic care, but can link mothers and children to social services and support in their local communities. Photo: Sarah L. Voisin/Washington Post via Getty Images
Midwife Cassandra Burrell examines pregnant patient Mia Mack at the Community of Hope Conway Health and Resource Center in Washington, D.C. Community-led and community-based organizations can not only provide patient-centered, holistic care, but can link mothers and children to social services and support in their local communities. Photo: Sarah L. Voisin/Washington Post via Getty Images
Toplines
State policy choices on health and social supports have a profound impact on maternal and child mortality
In 2023, the maternal death rate in Louisiana was more than four times as high as California’s, while infant mortality in Mississippi was nearly triple that of Massachusetts
Toplines
State policy choices on health and social supports have a profound impact on maternal and child mortality
In 2023, the maternal death rate in Louisiana was more than four times as high as California’s, while infant mortality in Mississippi was nearly triple that of Massachusetts
In the United States, the risk of dying from pregnancy-related causes is more than four times higher for someone giving birth in Louisiana than in California, and a child born in Mississippi is nearly three times more likely to die before age 5 than a child in Massachusetts. National averages can obscure this dramatic variation, much of which stems from state-level policy choices around Medicaid, reproductive health, hospital regulation, and social welfare, among others.
To examine variations within the U.S., this brief compares maternal and child mortality rates at the national, state, and racial and ethnic level to 200 countries. Comparing disaggregated U.S. rates to nations with similar population sizes and economies can illuminate how different policy environments shape health outcomes. Historically, states that invest more in health coverage, reproductive care, and social protections tend to have better health outcomes, in some cases on par with high-income countries, while states that invest less and pass more restrictive policies have outcomes similar to low- and middle-income or politically unstable countries.1
Disaggregating by race and ethnicity is critical for a full picture of maternal and child mortality in the U.S. as state and national mortality rates often mask worse outcomes for Black, American Indian and Alaska Native (AIAN), and Native Hawaiian and Pacific Islander (NHPI) communities. This brief draws on data from the U.S. Centers for Disease Control and Prevention (CDC), national registries, the World Health Organization (WHO), and the United Nations Inter-Agency Group for Child Mortality Estimation (UN IGME) (see “How We Conducted This Study” for more details).
Highlights
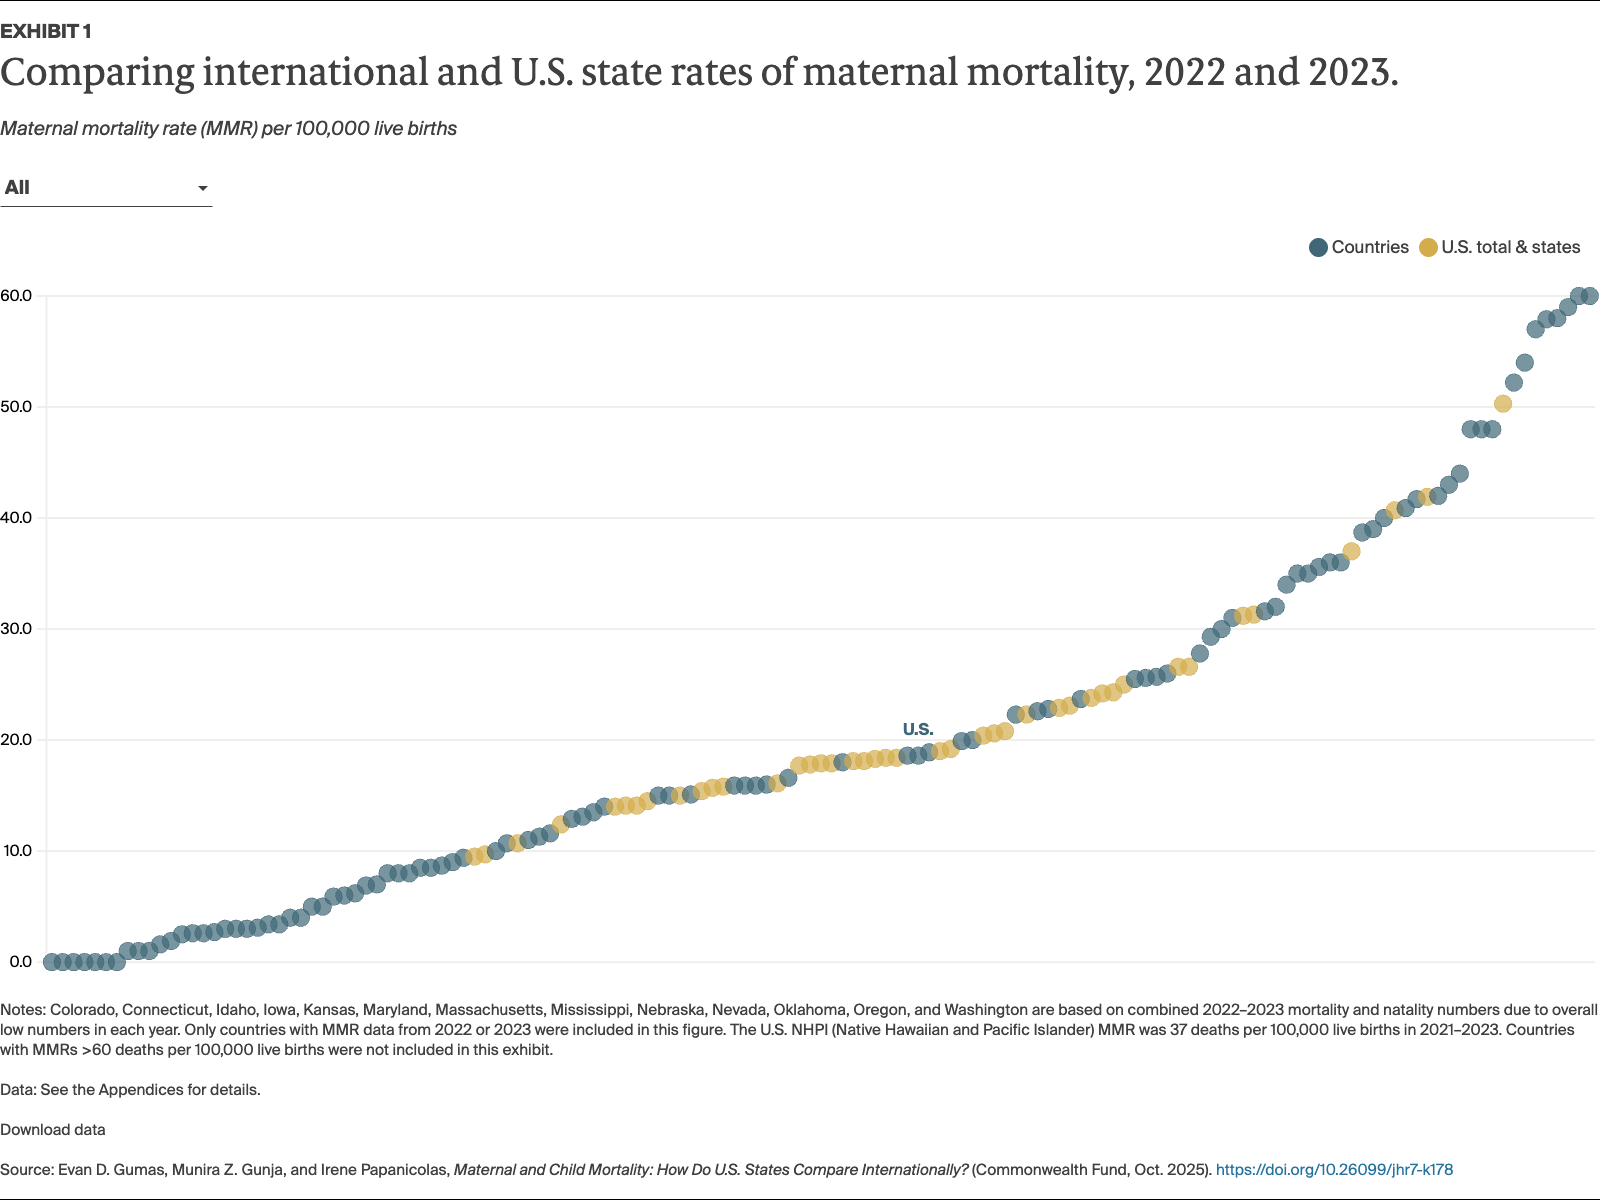
Despite declines in 2023, the overall U.S. maternal mortality rate (18.6 deaths per 100,000 live births) is higher than rates in the majority of all high-income countries. Mothers in Louisiana had the highest state rate of death in 2023 (41.9).
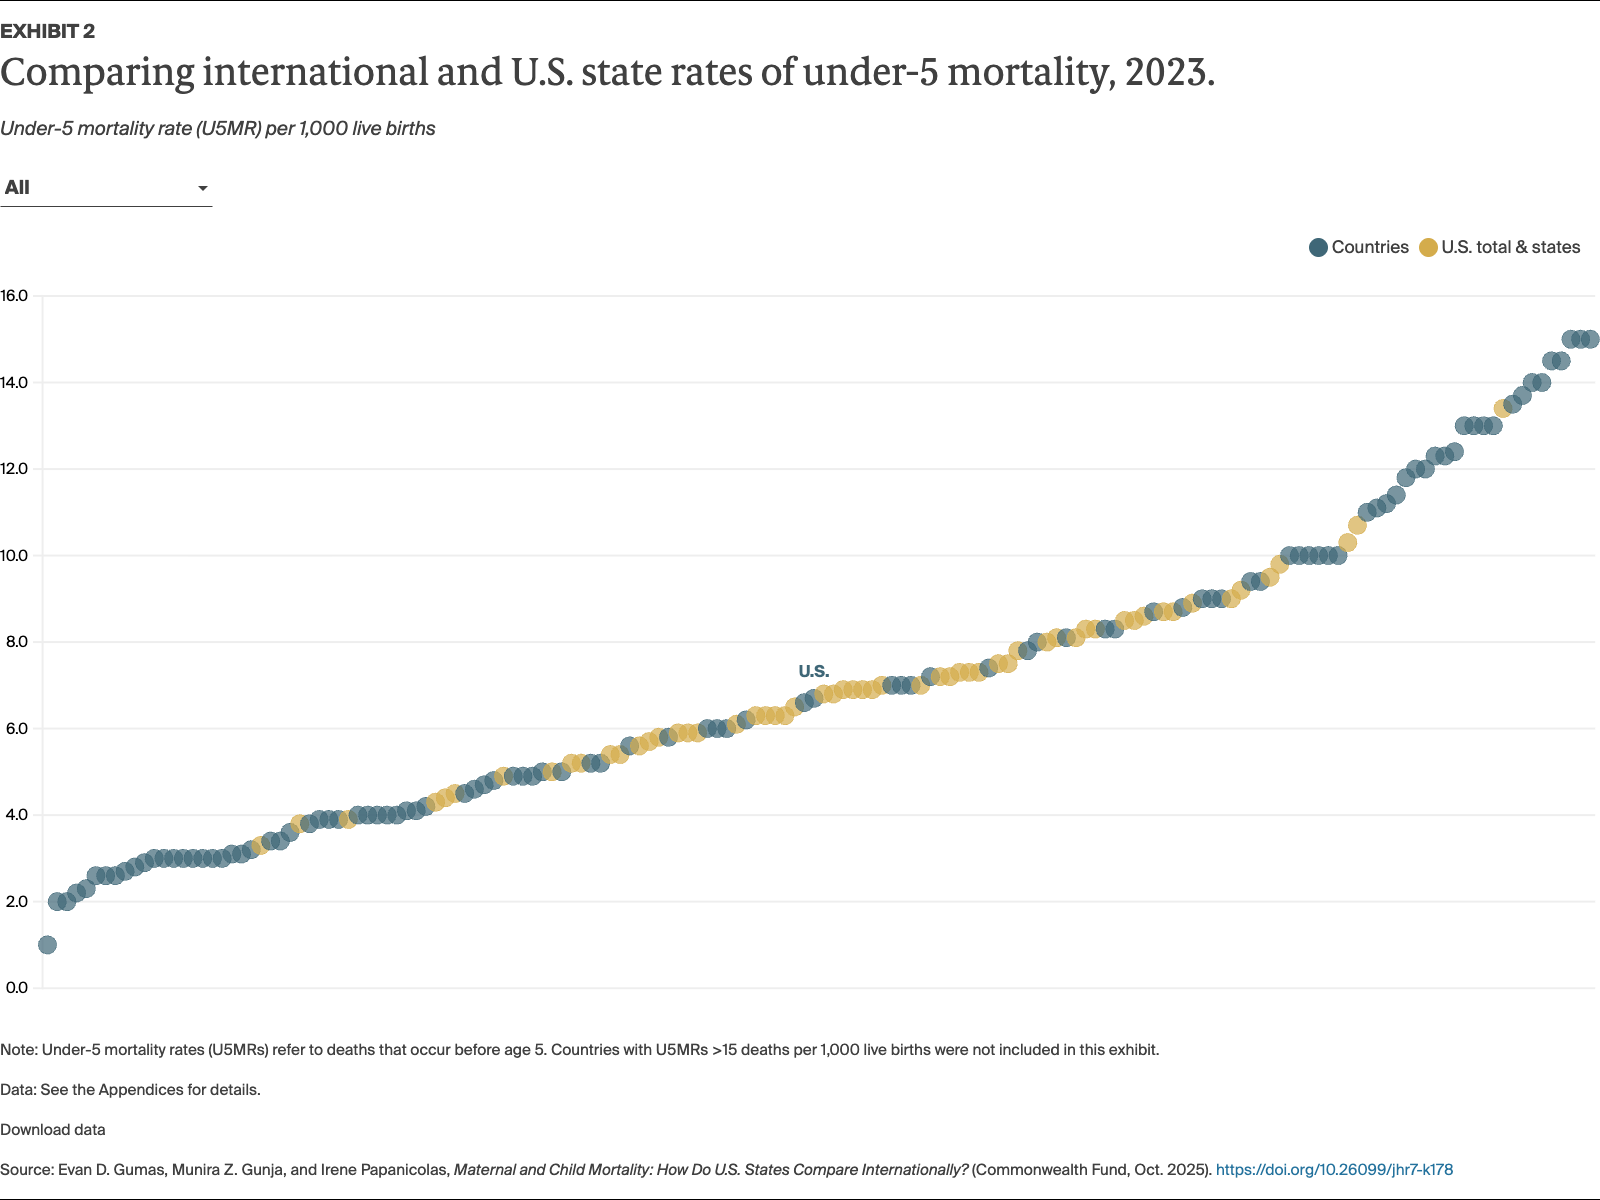
Nationally, under-5 mortality remained stable at 6.7 deaths per 1,000 live births in 2023, comparable to rates in Albania (6.6) and Chile (7.0); Mississippi (10.3) had the highest state rate and Massachusetts (3.8) had the lowest.
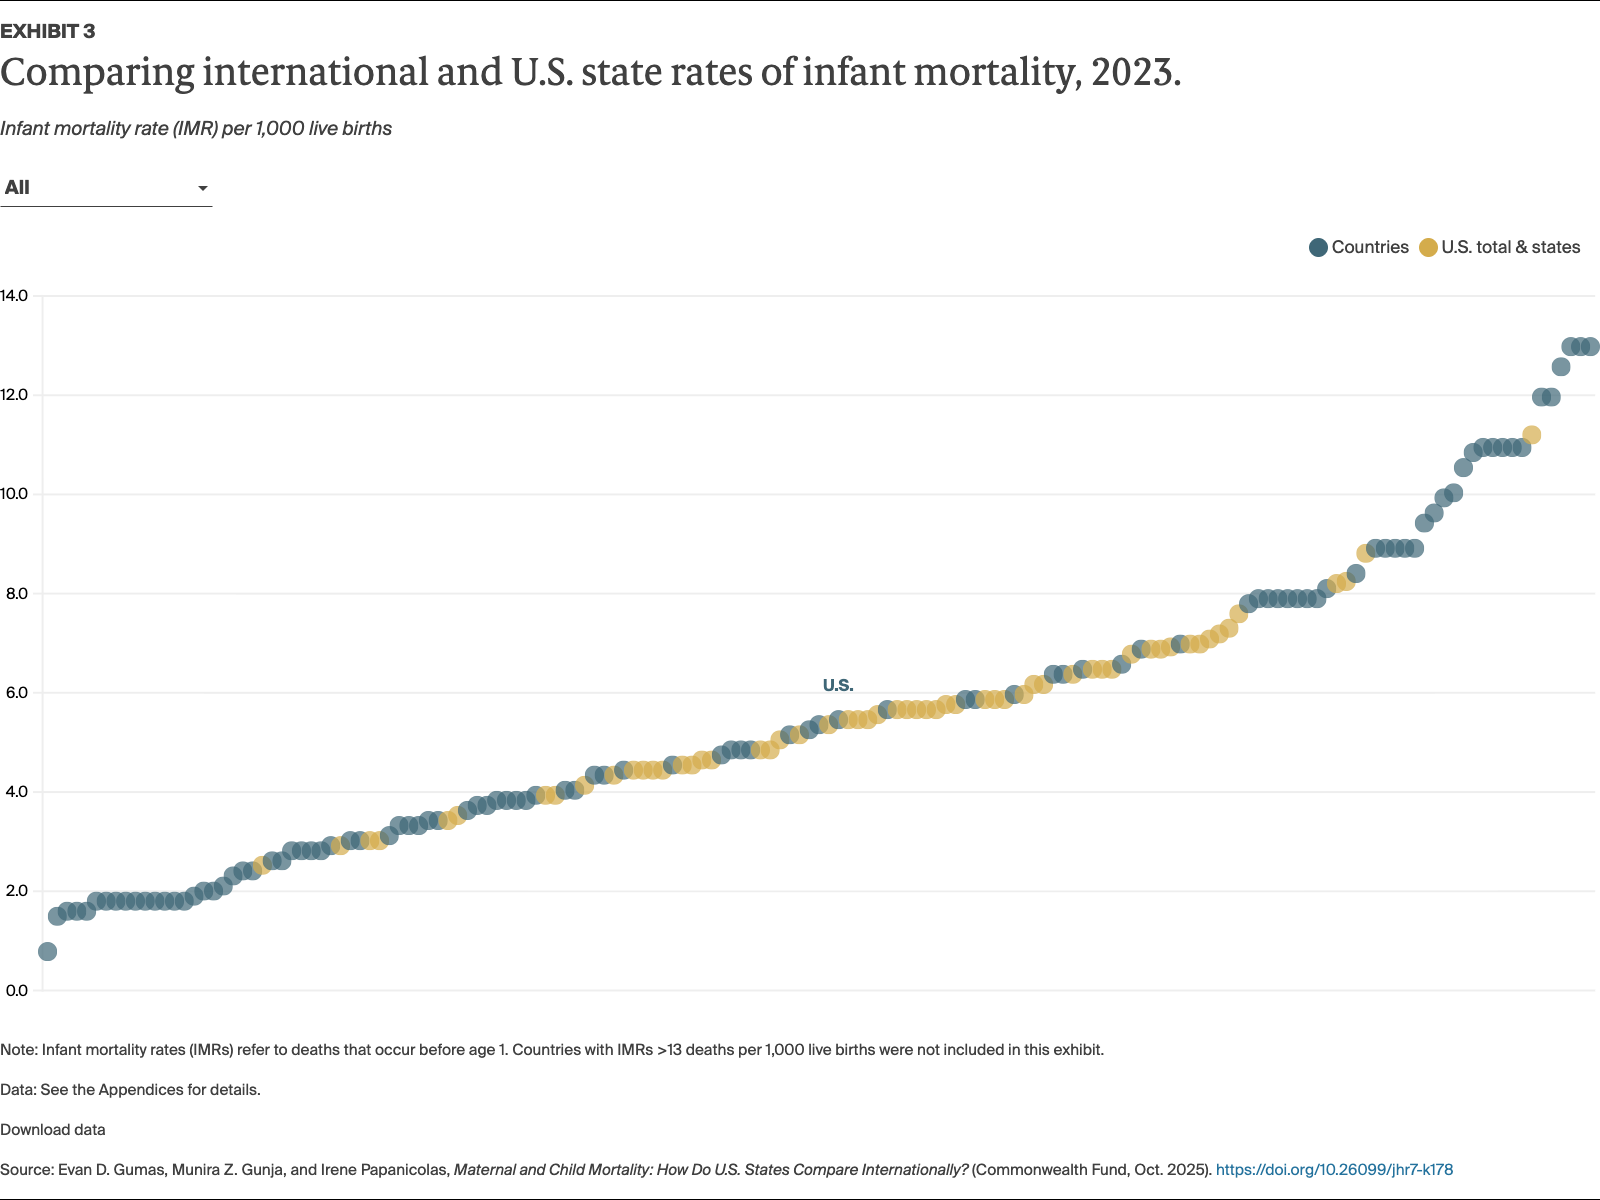
In 2023, the U.S. infant mortality rate (5.6 deaths per 1,000 live births) falls between Qatar (5.5) and Romania (5.8). Of all states, Mississippi (8.9) had the highest and New Hampshire (3.1) had the lowest infant mortality rates.
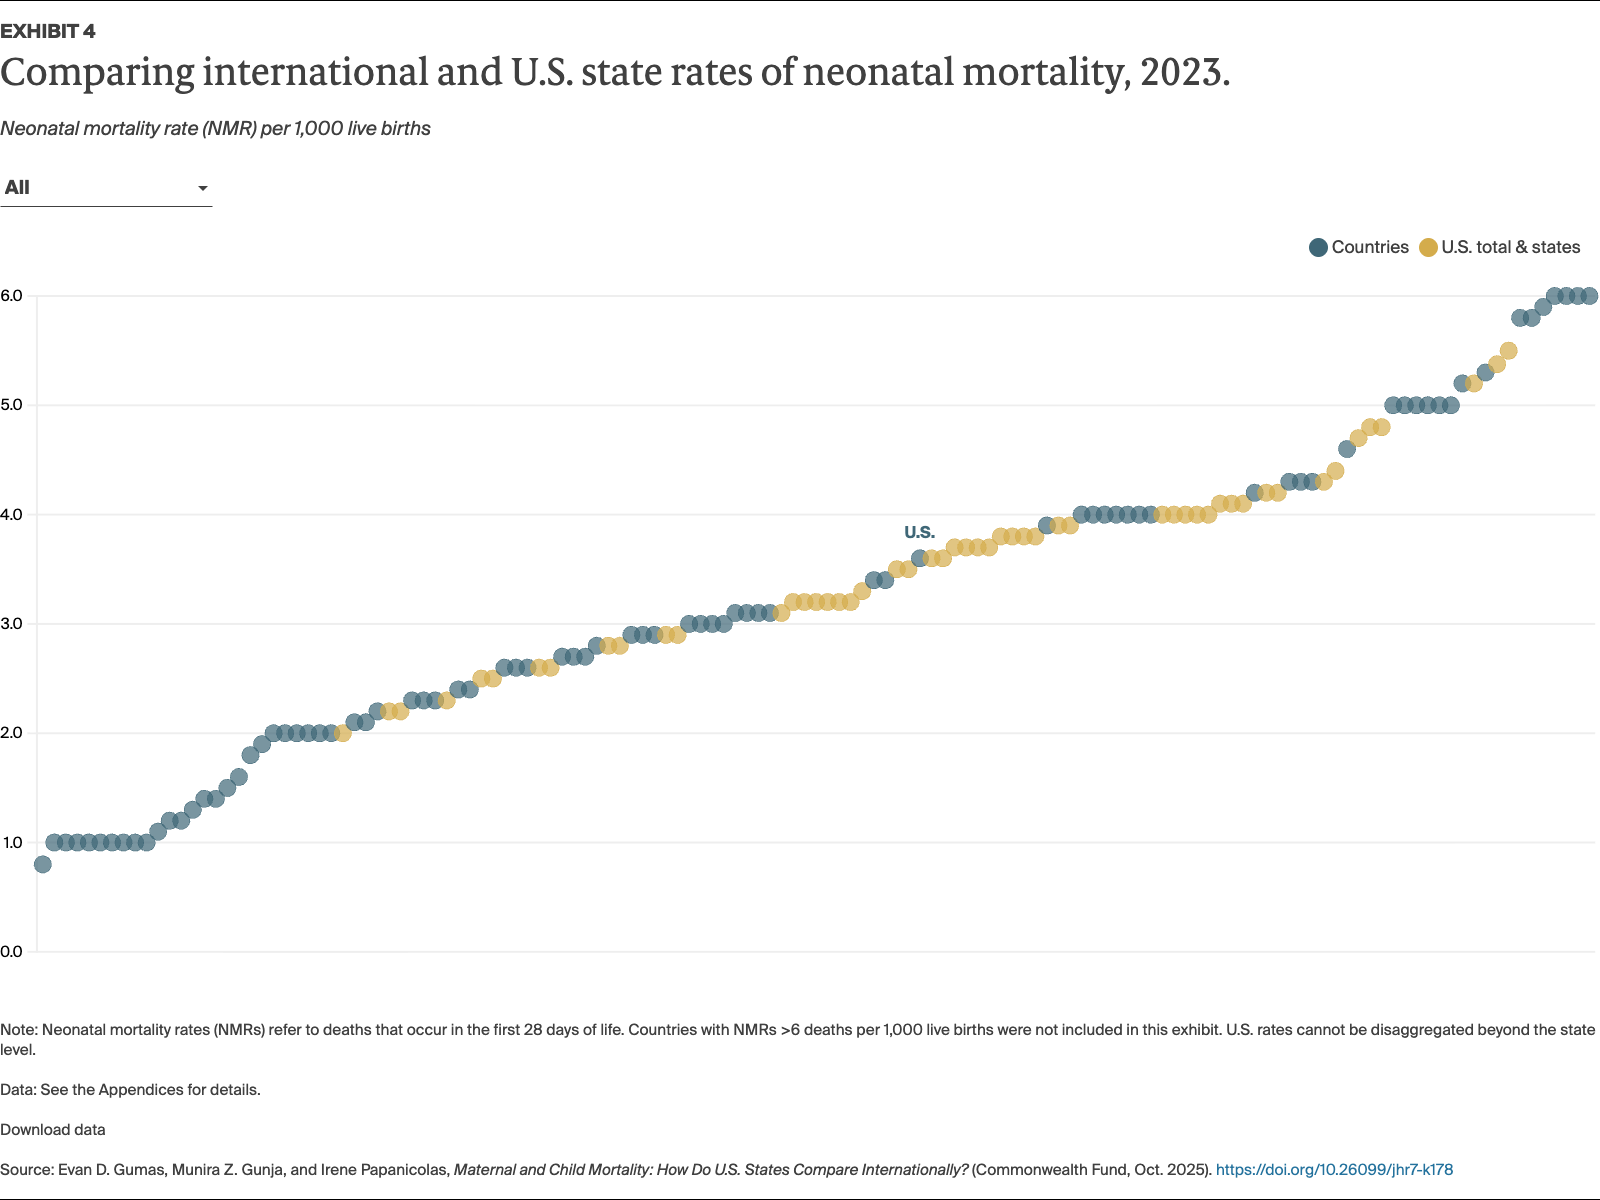
U.S. neonatal mortality (3.6 deaths per 1,000 live births) was comparable to Canada (3.4) in 2023; New Hampshire (2.0) had the lowest rate of all U.S. states and among the lowest rates of all countries in this analysis.
Black maternal and child mortality rates are the highest of any racial or ethnic group in the U.S., and as a group, Black children under age 5 have a higher mortality rate than any state or other demographic group, at 13.4 deaths per 1,000 live births — comparable to rates in Mexico (13.0) and Laos (13.5).
Findings
Maternal Mortality
In 2023, there were 18.6 maternal deaths for every 100,000 live births in the United States, a drop from 22.3 per 100,000 in 2022. Provisional 2024 data show maternal mortality rates remain steady at 17.9 deaths per 100,000 live births.
The overall U.S. maternal mortality rate most resembled rates in Palestine (18.6) and Chile (18.9). At the high end on the state level, Louisiana (41.9) fell between Mexico (41.7) and the Seychelles (42.0), while California (9.5) fell between Canada (9.4) and Kazakhstan (10.0), among the lowest global rates.
The Black maternal death rate remains the highest U.S. rate of any group, with 50.3 deaths per 100,000 live births — comparable to rates in Vietnam (48.0) and Brazil (52.2). Not far behind are rates for American Indian and Alaska Native (AIAN, 40.7) and Native Hawaiian and Pacific Islander (NHPI, 37.0) mothers (see “How We Conducted This Study” for more details on these rates).
Under-5 Mortality
In 2023, the U.S. death rate for children under age 5 was approximately 6.7 for every 1,000 live births, lower than where it stood in 2000 (8.1). The U.S. fell between Albania (6.6) and Chile (7.0). The state with the highest under-5 mortality rate, Mississippi (10.3), fell between Tonga (10.0) and Saint Vincent and the Grenadines (11.0), while the state with the lowest rate, Massachusetts (3.8), fell between Lithuania (3.6) and Australia (3.8), which have among the lowest rates in the world.
Black children under age 5 had the highest mortality rate at 13.4 deaths per 1,000 live births, comparable to rates in Tunisia (13.0) and Laos (13.5).
Infant Mortality
In 2023, there were 5.6 infant deaths for every 1,000 live births in the United States, the same as in 2022. Provisional 2024 data show infant mortality rates remaining at 5.5 deaths per 1,000 live births.
Overall, the U.S. infant mortality rate fell between Qatar (5.5) and Romania (5.8). At the state level, Mississippi (8.9) fell between Uzbekistan (8.5) and Barbados (9.0) at the high end, while New Hampshire (3.1) fell between Hungary (3.1) and Australia (3.2) at the low end.
The Black, AIAN, and NHPI infant mortality rates were 7.4 deaths per 1,000 live births or higher, the highest for all racial and ethnic groups. The lowest U.S. rate was for Asian American infants: 2.7 deaths per 1,000 live births, similar to Spain (2.6) and Belgium (2.8).
Neonatal Mortality
In 2023, there were 3.6 neonatal deaths — deaths that occur in the first 28 days after birth — for every 1,000 live births in the United States, similar to 2022 and, 2024, according to provisional data.
Overall, the U.S. neonatal mortality rate fell between Romania (3.4) and Bosnia and Herzegovina (3.9). At the high end, Puerto Rico (5.4) and Arkansas (5.5) fell between Peru (5.3) and Armenia (5.8). New Hampshire (2.0) had the lowest U.S. state rate, between those of Luxembourg (2.0) and Austria (2.1) — among the lowest rates in the world.
Neonatal mortality rates cannot be disaggregated further in the U.S. (see “How We Conducted This Study” for more details).
Discussion
Though this section disaggregates maternal and child health policy levers to tease out more detailed recommendations, it should be noted that maternal and child health outcomes are inextricably linked.
Maternal Mortality
Over the past 25 years, maternal mortality rates have dropped in almost all countries. Despite a slight decline in maternal mortality overall since 2022, the United States is one of the only high-income countries to have seen a rise in maternal deaths in this period. Prior to the COVID-19 pandemic, this increase was in large part due to changes in how maternal deaths are reported (see “How We Conducted This Study” for more details).2 In 2023, the leading causes of maternal mortality in the U.S. were obstetric, maternal disorders, and postpartum complications.3
Racial and ethnic disparities are a significant issue in the U.S., much like in Australia, Brazil, Canada, the United Kingdom, and many other countries.4 Black mothers in the U.S. die at a rate nearly three times the national average and the rate of white women, and five times the rate of Asian women.5 Similarly, AIAN and NHPI mothers die at a rate more than double the national average and more than four times the rate of Asian mothers. Structural racism is the fundamental driver of disparities by race and ethnicity, with impact far beyond the doctor’s office as the unequal allocation of risks and resources creates structural disadvantages that build over the course of a person’s life, resulting in higher rates of maternal death.6
Globally, policies that improve universal access to high-quality maternal care involve expanding and diversifying the workforce; providing comprehensive maternal health support, specifically pre- and postnatal care, skilled birth attendants, and safe abortion services; and addressing underlying social drivers of maternal mortality and morbidity.
Policies That Improve Maternal and Child Health
Globally, numerous policy interventions have proven effective in reducing maternal and infant deaths. Four notable examples are highlighted below, alongside similar policies in select U.S. states.
Expanding the role of midwives and community health providers
After Chile increased the role and responsibilities of midwives at all levels of maternal care, particularly in primary care, the country saw a decrease of over 50 percent in maternal deaths since 2000.7
New Mexico has a nearly 20-year-old Medicaid midwifery benefit and provisions that allow midwives without a nursing degree to practice independently and order key tests and procedures both pre- and postpartum.8
Ensuring access to safe abortion services
After Ethiopia expanded access to abortion in 2005 for cases of rape, incest, or fetal impairment; danger to the mother’s life or physical health; or if the mother has disabilities, or is a minor, there was a more than threefold drop in abortion-related mortality.9
Following the U.S. Supreme Court’s decision to overturn federal abortion protections in 2022, states that defended abortion access saw maternal mortality fall by 21 percent.10
Providing postpartum home visits
Ireland provides guaranteed home visits by a midwife or public health nurse in the six months after birth, with a public health nurse continuing to see the mother and child over the next four years.11 The country reported zero maternal deaths in 2022.12
In the U.S., all states and territories leverage Maternal, Infant, and Early Child Home Visiting Programs, of which Indiana — whose maternal mortality rate has dropped precipitously since 2022 — has recently reauthorized its program through 2028.13 As of 2023, at least 28 states provide Medicaid reimbursement for some home visiting services.14
Expanding access to reproductive health and family planning
The Maldives scaled up the number of obstetric facilities to a place of care within two hours of every family and undertook a family planning education initiative including mass media campaigns, home visits, and increased access to contraceptives. Over the past three decades, the country has seen a 90 percent drop in its maternal mortality rate.15
California’s Family Planning, Access, Care, and Treatment Program provides comprehensive family planning services to low-income Californians, including birth control, family planning counseling, sexually transmitted infection testing and treatment, HIV testing, cervical cancer screening, and many other services, preventing hundreds of thousands of unintended pregnancies since 1996.16
Confronting the maternal mortality crisis in the United States requires the following:
Leveraging the social drivers of health to expand equitable access to care: Ensuring access to health care, nutritious food, affordable transportation, pre- and postpartum home visits, and paid maternity leave are crucial to improving maternal outcomes.17 In the U.S., nearly 8 million women of reproductive age remain uninsured, disproportionately women of color. Expanding Medicaid in the 10 states that have not done so — four of which have among the highest maternal and child mortality rates in the country — is vital to improving access to preconception and postpartum care. Community-led and community-based organizations can not only provide patient-centered, holistic care, but can link mothers and children to social services and support in their local communities.18
Investing in and diversifying the maternal health workforce: Doulas, midwives, nurse practitioners, and other maternal health care providers are a vital part of health systems globally, shown to improve patient outcomes and experiences, particularly for communities of color, yet they are underutilized in the U.S.19 Although Medicaid is required to reimburse midwifery services, inconsistent private insurance coverage, low reimbursement rates, and a limited midwife workforce nationally hinders access in many parts of the country.20 As of 2025, 27 states and Washington, D.C., cover doula services or are in the processing of extending Medicaid coverage for doula services, and just two states (Louisiana and Rhode Island) reimburse doula services in private insurance plans.21 Increasing reimbursement rates and supporting maternal health education programs for more maternal health specializations are essential for scaling the workforce.
Guaranteeing comprehensive postpartum support: Two of three maternal deaths occur in the year after delivery.22 Only 14 states provide paid parental leave (ranging from four to 12 weeks), while home visits for new mothers and infants vary based on state Medicaid program or private insurer.23 Establishing federal requirements for paid parental leave, expanding state-level parental leave programs, and universalizing postpartum home visits through Medicaid can ensure continuity of care in this crucial period.24
Strengthening and standardizing data collection: Although all 50 states, Washington D.C., and Puerto Rico operate maternal mortality review commissions (MMRCs), these all vary in their scope, resources, and ability to act on findings. Ensuring consistent, adequate funding, mandating the collection of comprehensive, standardized, comparable data, and empowering MMRCs to recommend and monitor policy changes are essential to translating data to action.25
Under-5, Infant, and Neonatal Mortality
Infant and under-5 deaths are closely tied to the barriers families face in accessing high-quality maternal and newborn care in this critical phase of development. In the U.S., deaths after infancy, occurring between ages 1 and 4, are due to factors such as infectious disease, malnutrition, and unintentional injuries, including motor vehicle accidents and gun violence, among many others.
While under-5 mortality in the United States generally falls around the global average, the U.S. ranks in the 71st percentile compared to high-income countries, meaning under-5 mortality in the U.S. is worse than in over two-thirds of high-income countries.26 Japan and Estonia have among the lowest child mortality rates in the world. Health systems in both countries ensure services are widely available, accessible, and affordable, with emphasis placed on minimizing financial and geographic barriers, good nutrition, generous parental leave, and strong social safety nets.27
In the U.S., more than 70 percent of deaths under age 5 occur during infancy, and nearly two of three infant deaths occur during the neonatal stage. Reducing the number of under-5 deaths requires:
Ensuring universal, continuous, and comprehensive coverage for all infants and young children. While programs such as Medicaid and the Children’s Health Insurance Program (CHIP) provide coverage to nearly half of all children in the U.S., gaps remain.28 Children with public insurance have higher rates of inconsistent coverage at 1 year of age compared to commercially insured children, and lower rates of inadequate coverage, or underinsurance, particularly with associated factors like lower household income, chronic conditions, and disabilities.29 Uninsured women and their newborns also receive less maternity and neonatal care than their insured counterparts, and they experience more adverse outcomes, like low birthweight and death.30 As Medicaid eligibility thresholds shift after birth, many low-income mothers and infants lose or face inconsistent coverage, leading to gaps in preventive care visits, delayed treatments, and opportunities to catch or address potential complications in a timely manner.31 Extending Medicaid coverage for infants beyond one year and facilitating seamless transitions between CHIP and Medicaid could reduce coverage churn around the pregnancy and postpartum period.32
Strengthening social and physical infrastructure to support young children and their families. Meaningful investment in social and physical infrastructure needs to be combined with robust legal protections for mothers and children to secure necessities like paid parental leave and physical infrastructure like transportation and housing.33 In 2023, 450,000 infants and toddlers experienced homelessness, a 23 percent increase from 2022. Just 10 percent of these infants and toddlers received support from federal early childhood programs.34 Beyond homelessness, one in six children under age 5, or 3 million children, were poor (the highest rate of any age group), and 11 percent faced food insecurity.35 Ensuring access to affordable health care, nutritious food, affordable public transportation, pre- and postpartum home visits, and paid maternity leave, among many others, are key factors that can improve outcomes for under-5 children.36
Conclusion
The 2022 Supreme Court decision to overturn Roe v. Wade sharpy reduced access to safe abortion care in many states, forcing some women to continue high-risk pregnancies or seek delayed and unsafe procedures.37 Recent funding cuts to Medicaid — the public program that covers more than half of all births in the country — will likely deepen coverage instability during pregnancy and after delivery, periods already marked by high rates of churn and care disruptions that contribute to poor maternal and infant health outcomes.38
With policies for mothers and children varying by state, some U.S. states actually do perform comparably to other high-income countries. Others states lag, with outcomes more comparable to low- and middle-income countries. Variations highlight the need for federal protections to ensure consistent coverage, maternal and child health services, and quality of care regardless of state of residence, race and/or ethnicity, or economic background. Continuing to learn from countries and states where policy changes have resulted in marked improvements can help reduce preventable deaths and secure safer and healthier futures for all mothers and children in the United States.
How We Conducted This Study
Data used in this brief were pulled from national statistics offices based on the latest available data for each country and in many cases were verified by contacts at each agency for their accuracy and recency. For countries where rates were not available, rates were supplemented from recent reports from the World Health Organization (WHO) and the United Nations Inter-Agency Group for Child Mortality Estimation (UN IGME).
Maternal Mortality Rates
The U.S. National Center for Health Statistics (NCHS) defines maternal mortality according to the World Health Organization’s definition as the death of a woman while pregnant or within 42 days of termination of pregnancy, irrespective of the duration and site of the pregnancy, from any cause related to or aggravated by the pregnancy or its management, but not from accidental or incidental causes.39 In the United States, maternal deaths are coded according to the 10th revision of the International Classification of Diseases (ICD-10), with underlying cause of death coded as any of the following: A34 (obstetric tetanus); O00-O95 (conditions including pregnancy with abortive outcome, hypertensive disorders in pregnancy, childbirth, and the puerperium, maternal hemorrhage, maternal sepsis, and many other conditions); O98-99 (indirect obstetric deaths where conditions that existed prior to or during pregnancy were exacerbated by pregnancy).40
In the U.S., the apparent worsening of maternal mortality relative to other high-income countries should be interpreted with caution. Beginning in 2003, states began adopting a standardized pregnancy checkbox on death certificates, denoting whether a death was considered maternal (pregnant at the time of death or not pregnant, but pregnant within 42 days of death) or late maternal (not pregnant, but pregnant within 43 days to 1 year before death). While this checkbox has improved identification of maternal deaths, it has also increased the number of deaths identified as maternal and, despite being introduced in 2003, all states had not fully implemented this checkbox until 2017, resulting in increases in the overall U.S. maternal mortality rate. Prior to the COVID-19 pandemic, the increase in maternal mortality has been almost entirely attributed to the change in reporting.41 This improved surveillance has corrected for the previous underreporting of maternal deaths in the U.S., but also underscores the need for other countries to adopt similar methods to ensure cross-country comparability and accurate measurement of maternal deaths. A number of countries have introduced similar checkboxes, though wording may vary by country, and some countries may employ different processes to identify, document, and review maternal deaths.42
In nearly all countries, maternal deaths are defined using ICD-10 codes under chapter O, referring to underlying deaths due to “pregnancy, childbirth, and the puerperium.” The maternal mortality rate (MMR) is then calculated by dividing the number of maternal deaths by the number of live births in the given year, then multiplying by 100,000:
In the U.S., reporting standards of the U.S. Centers for Disease Control and Prevention (CDC) suppress counts and/or rates if fewer than 10 cases (or deaths) were reported in a specific category, such as mortality type, race or ethnicity, age, or state.43 In this analysis, if states did not have more than 10 maternal deaths in 2023, data were combined with 2022 data (i.e., 2022 maternal deaths + 2023 maternal deaths ÷ 2022 live births + 2023 live births) in order to generate a value for each state. For several states, counts were still below 10, resulting in their exclusion in Exhibit 1; see the Appendices for full state data. This method was applied to race and ethnicity data as well, with the exception of Native Hawaiian and Pacific Islander (NHPI) populations, where data years 2021–2023 were combined to generate an MMR, as analyses often do not include NHPI populations, creating a blind spot for a sizeable portion of the U.S. population.44 See Appendix 2 for rates and which state or territory rates are based on combined rates, or were suppressed.
Internationally, maternal mortality rates were pulled from national statistics offices. If rates were not calculated by country statistics offices, they were calculated by pulling raw maternal deaths (ICD-10 chapter O: pregnancy, childbirth, and the puerperium) and raw number of birth data. Rates were then verified individually by national statistics offices or by health ministries. Adhering to CDC standards, if the country’s maternal deaths fell below 10 deaths or the country did not report a maternal mortality rate due to low numbers, the country rate was suppressed. In countries where rates were not available or calculable, rates were supplemented by the World Health Organization’s latest 2025 maternal mortality report.45
Rates for some countries should be interpreted with caution, as mortality numbers may be underreported due to incomplete mortality data or lack of appropriate coding. Country methods for reporting and determining maternal mortality rates also may vary slightly, depending on whether deaths are finalized by review committees or reported in broader mortality data. For the purposes of this analysis, these are the most complete cross-national estimates, based on previously established methods.46
The rates presented in this analysis represent the most recently available international data reported by individual countries for maternal mortality and provide an important foundation for understanding current international differences. They also represent the need for further international data standardization and collaboration.
In Exhibit 1, in order to visualize U.S. state, territory, and country comparisons, the upper limit of the distribution was set at 60 deaths per 100,000 live births to avoid including extreme outliers. See the Appendices for full analysis data and specific sources.
Child Mortality Rates
In the U.S., child deaths are coded according to the 10th revision of the International Classification of Diseases (ICD-10), with underlying cause of death coded as any death occurring in given time periods:47
Under-5 Mortality Rate
Under-5 mortality rates (U5MR) were calculated using the following method:
In the U.S., 2023 U5MRs were calculable for all state, territory, and racial/ethnic groups.
Internationally, U5MRs were pulled from national statistics offices. If rates were not calculated by country statistics offices, they were calculated by pulling raw under-5 deaths (all deaths coded under ICD-10 that occurred before age 5) and raw number of birth data. Rates were then verified individually by national statistics offices or by health ministries. In countries where rates were not available or calculable, rates were supplemented by the UN IGME Report 2024.48 Rates for some countries should be interpreted with caution as mortality numbers may be underreported due to incomplete mortality data or lack of appropriate coding. For the purposes of this analysis, these are the most complete cross-national estimates.
In Exhibit 2, in order to visualize U.S. state, territory, and country comparisons, the upper limit of the distribution was set at 15 deaths per 1,000 live births to avoid including extreme outliers. See the Appendices for full analysis data and specific sources.
Infant Mortality Rate
Infant mortality rates (IMR) were calculated using the following method:
In the U.S., 2023 IMRs were calculable for all state, territory, and racial/ethnic groups.
Internationally, IMRs were pulled from national statistics offices. If rates were not calculated by country statistics offices, they were calculated by pulling raw infant deaths (all deaths coded under ICD-10 that occurred within the first year of life, <1 year) and raw number of birth data. Rates were then verified individually by national statistics offices or health ministries. In countries where rates were not available or calculable, rates were supplemented by the UN IGME Report 2024.49 Rates for some countries should be interpreted with caution, as mortality numbers may be underreported due to incomplete mortality data or lack of appropriate coding. For the purposes of this analysis, these are the most complete cross-national estimates.
In Exhibit 3, in order to visualize U.S. state, territory, and country comparisons, the upper limit of the distribution was set at 13 deaths per 1,000 live births to avoid including extreme outliers. See the Appendices for full analysis data and specific sources.
Neonatal Mortality Rate
Neonatal mortality rates (NMR) were calculated using the following method:
In the U.S., 2023 NMRs were calculable for all states. Due to CDC reporting limitations, rates are not calculable by race/ethnicity.
Internationally, NMRs were pulled from national statistics offices. If rates were not calculated by country statistics offices, they were calculated by pulling raw neonatal deaths (all deaths coded under ICD-10 that occurred within the first 28 days after birth) and raw number of birth data. Rates were then verified individually by national statistics offices or by health ministries. In countries where rates were not available or calculable, rates were supplemented by the UN IGME Report 2024.50
Neonatal mortality estimates are sensitive to reporting practices. For example, in some countries, extremely preterm or low-birthweight infants are classified as live births and subsequently recorded as neonatal deaths, while in other countries these deaths are classified as stillbirths. This difference in definition may inflate the U.S. rate relative to some countries with different reporting practices and should be should be interpreted with caution.51 Additionally, mortality numbers may be underreported due to incomplete mortality data or lack of appropriate coding. For the purposes of this analysis, these are the most complete cross-national estimates.
In Exhibit 4, in order to visualize U.S. state, territory, and country comparisons, the upper limit of the distribution was set at 6 deaths per 1,000 live births to avoid including extreme outliers. See the Appendices for full analysis data and specific sources.
Limitations
As noted previously, completeness of mortality data remains a challenge in many countries, particularly those whose vital statistics collection systems are in development. As such, some countries may underreport final mortality counts, meaning their maternal or child mortality rates presented in this analysis present underestimates.
For the majority of countries where 2023 maternal or child mortality rates were pulled or calculated from publicly available data, the rates were verified by contacting each respective national statistics office. Despite contacting some offices, responses were never received, meaning these estimates are the most recent and accurate responses available to the research team based on what was accessible on each national statistics site.
In the United States, provisional data do not link mortality data and live birth data for race and ethnicity, meaning rates may under- or overestimate counts for some states in provisional data findings. As such, provisional rates should be interpreted with caution and not reported as final until the CDC provides final 2024 data in early 2026. Provisional data as of September 17, 2025.
Acknowledgments
The authors would like to thank Aishu Balaji, Chris Hollander, Paul Frame, Jen Wilson, Bethanne Fox, Tony Shih, Gretchen Jacobson, Arnav Shah, Laurie Zephyrin, Karina Polanco, Claire Coen, and Neil Powe of the Commonwealth Fund for their help with this brief.
The authors would also like to thank Eugene Declercq of Boston University and Drs. Onikepe Owolabi and Hannah Olson of the Guttmacher Institute for their review of this brief.
Commonwealth Fund analysis of CDC WONDER. Obstetric conditions refer to conditions like maternal infectious or parasitic diseases, mental disorders, nervous, circulatory, respiratory, and other diseases and conditions complicating pregnancy, childbirth, and the puerperium, among others. Maternal disorders refer to infections, diabetes arising from pregnancy or existing before pregnancy, and liver disorders, among others. ↩
M.F. O’Hare et al., Data Brief No 7 (Maternal Death Enquiry Ireland, Oct. 2024). ↩
Tierra Brooks et al., Maternal Mortality in Indiana (Indiana University Public Policy Institute, Center for Research on Inclusion and Social Policy, Apr. 2025). ↩
Evan D. Gumas, Munira Z. Gunja, and Irene Papanicolas, Maternal and Child Mortality: How Do U.S. States Compare Internationally? (Commonwealth Fund, Oct. 2025). https://doi.org/10.26099/jhr7-k178