
Advanced Search

Advanced Search

Current Filters

Filter your query

Publication Types

Other

to

Fund Reports

/

The Commonwealth Fund 2026 State Health Disparities Report

Man and daughter wait in doctors waiting room

Carlos Gonzalez waits with his stepdaughter, Amber Banderas, 9, as she plays while waiting to get a flu shot at Children’s Hospital Child Health Clinic in Aurora, Colo., on October 7, 2025. After hitting record lows, the number of people skipping care because of cost is rising again. The increase is steepest among Hispanic and American Indian & Alaska Native communities. Photo: RJ Sangosti/MediaNews Group/Denver Post via Getty Images

Carlos Gonzalez waits with his stepdaughter, Amber Banderas, 9, as she plays while waiting to get a flu shot at Children’s Hospital Child Health Clinic in Aurora, Colo., on October 7, 2025. After hitting record lows, the number of people skipping care because of cost is rising again. The increase is steepest among Hispanic and American Indian & Alaska Native communities. Photo: RJ Sangosti/MediaNews Group/Denver Post via Getty Images

Toplines
  • Racial and ethnic health disparities persist in every state and are likely to get worse as recent federal policy changes take hold

  • Rates of people skipping needed care because of cost are once again on the rise, with Hispanic and AIAN communities seeing the steepest increases

Toplines
  • Racial and ethnic health disparities persist in every state and are likely to get worse as recent federal policy changes take hold

  • Rates of people skipping needed care because of cost are once again on the rise, with Hispanic and AIAN communities seeing the steepest increases

Introduction

Why Measure Health Disparities?

Disparities in health and health care between racial and ethnic groups do not exist in the abstract. In every U.S. state, differences in access to care, quality of care, or outcomes of care affect people’s health and well-being: whether they can afford to see a doctor or fill a prescription; whether a preventable or treatable condition like hypertension or diabetes is diagnosed and treated early; whether an illness undermines a family’s financial stability; or whether people trust the health care system enough to seek care when they need it.

By measuring and reporting on health disparities, we help to ensure that people’s health care experiences and outcomes are not hidden in averages for the entire population. Having this information enables states and health systems to assess how well they are using resources to improve health outcomes for everyone. As this report shows, state policy choices can either reduce disparities or allow them to widen, with lasting consequences for people’s health.

Since 2021, the Commonwealth Fund has published two reports examining health disparities between racial and ethnic groups across the United States and tracking differences within and between states. We’ve focused on three core areas of health system performance: access to affordable care, quality and use of health services, and health outcomes. In this third edition of the State Health Disparities Report, we draw on the most recent nationally comparable data available (2022–2024) to evaluate these differences. (For more complete details on our methods, see How We Measure Performance of States’ Health Care Systems for Racial and Ethnic Groups.)

What’s Changed Since Our Last Report

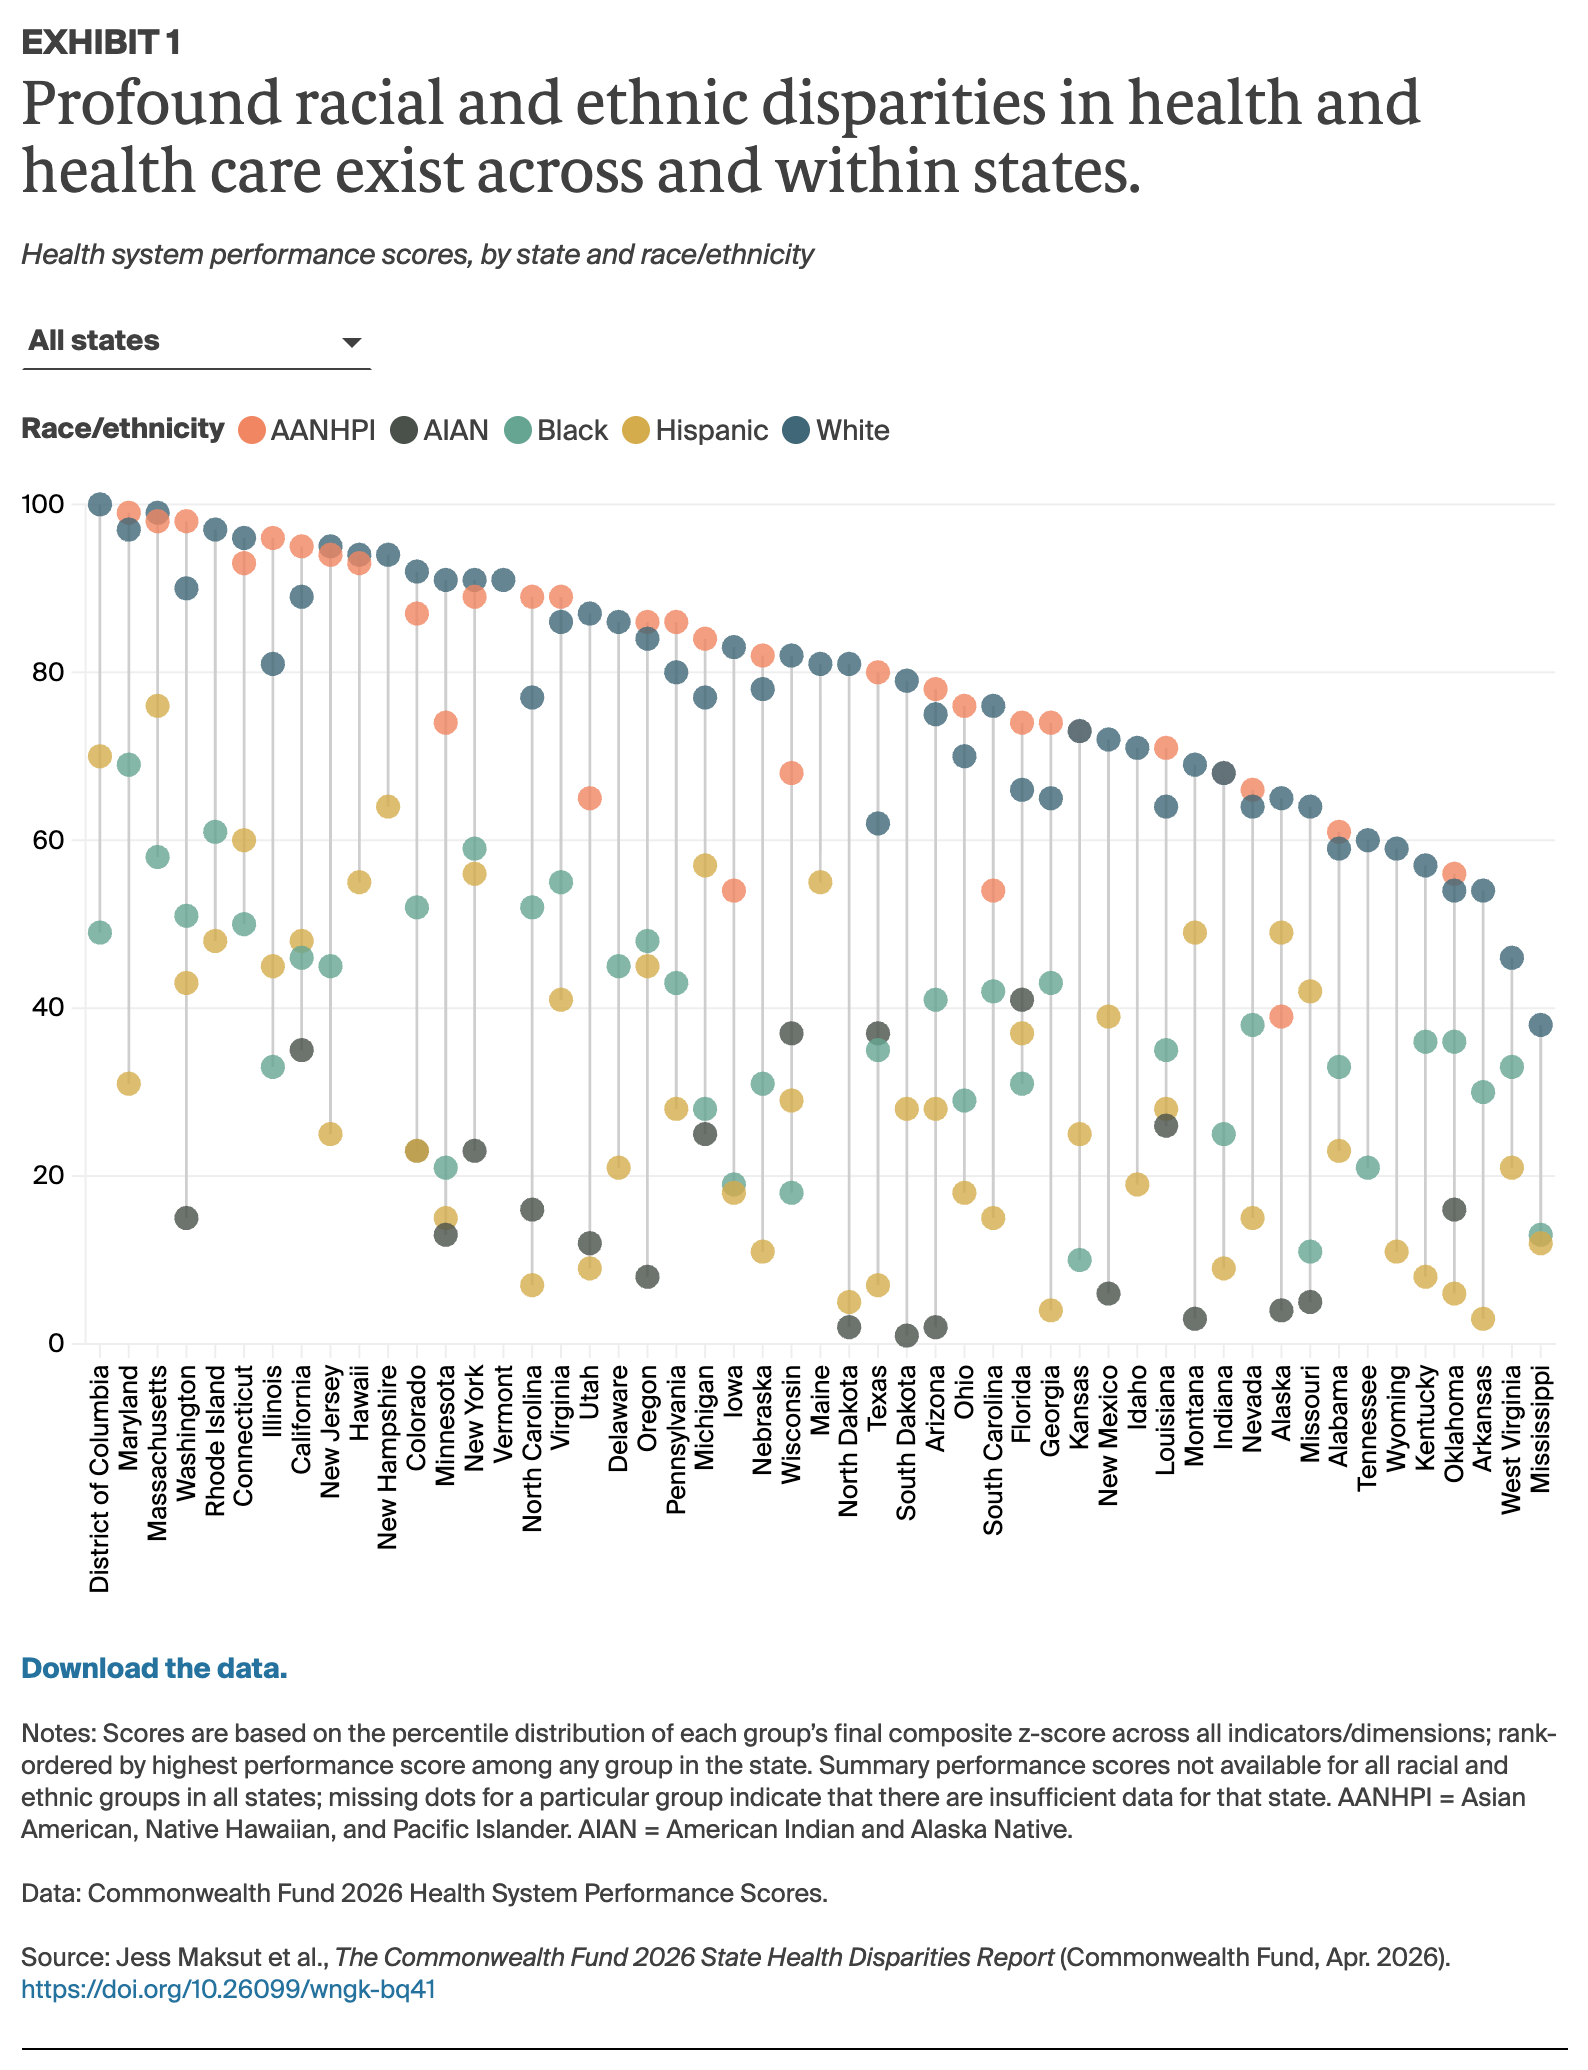
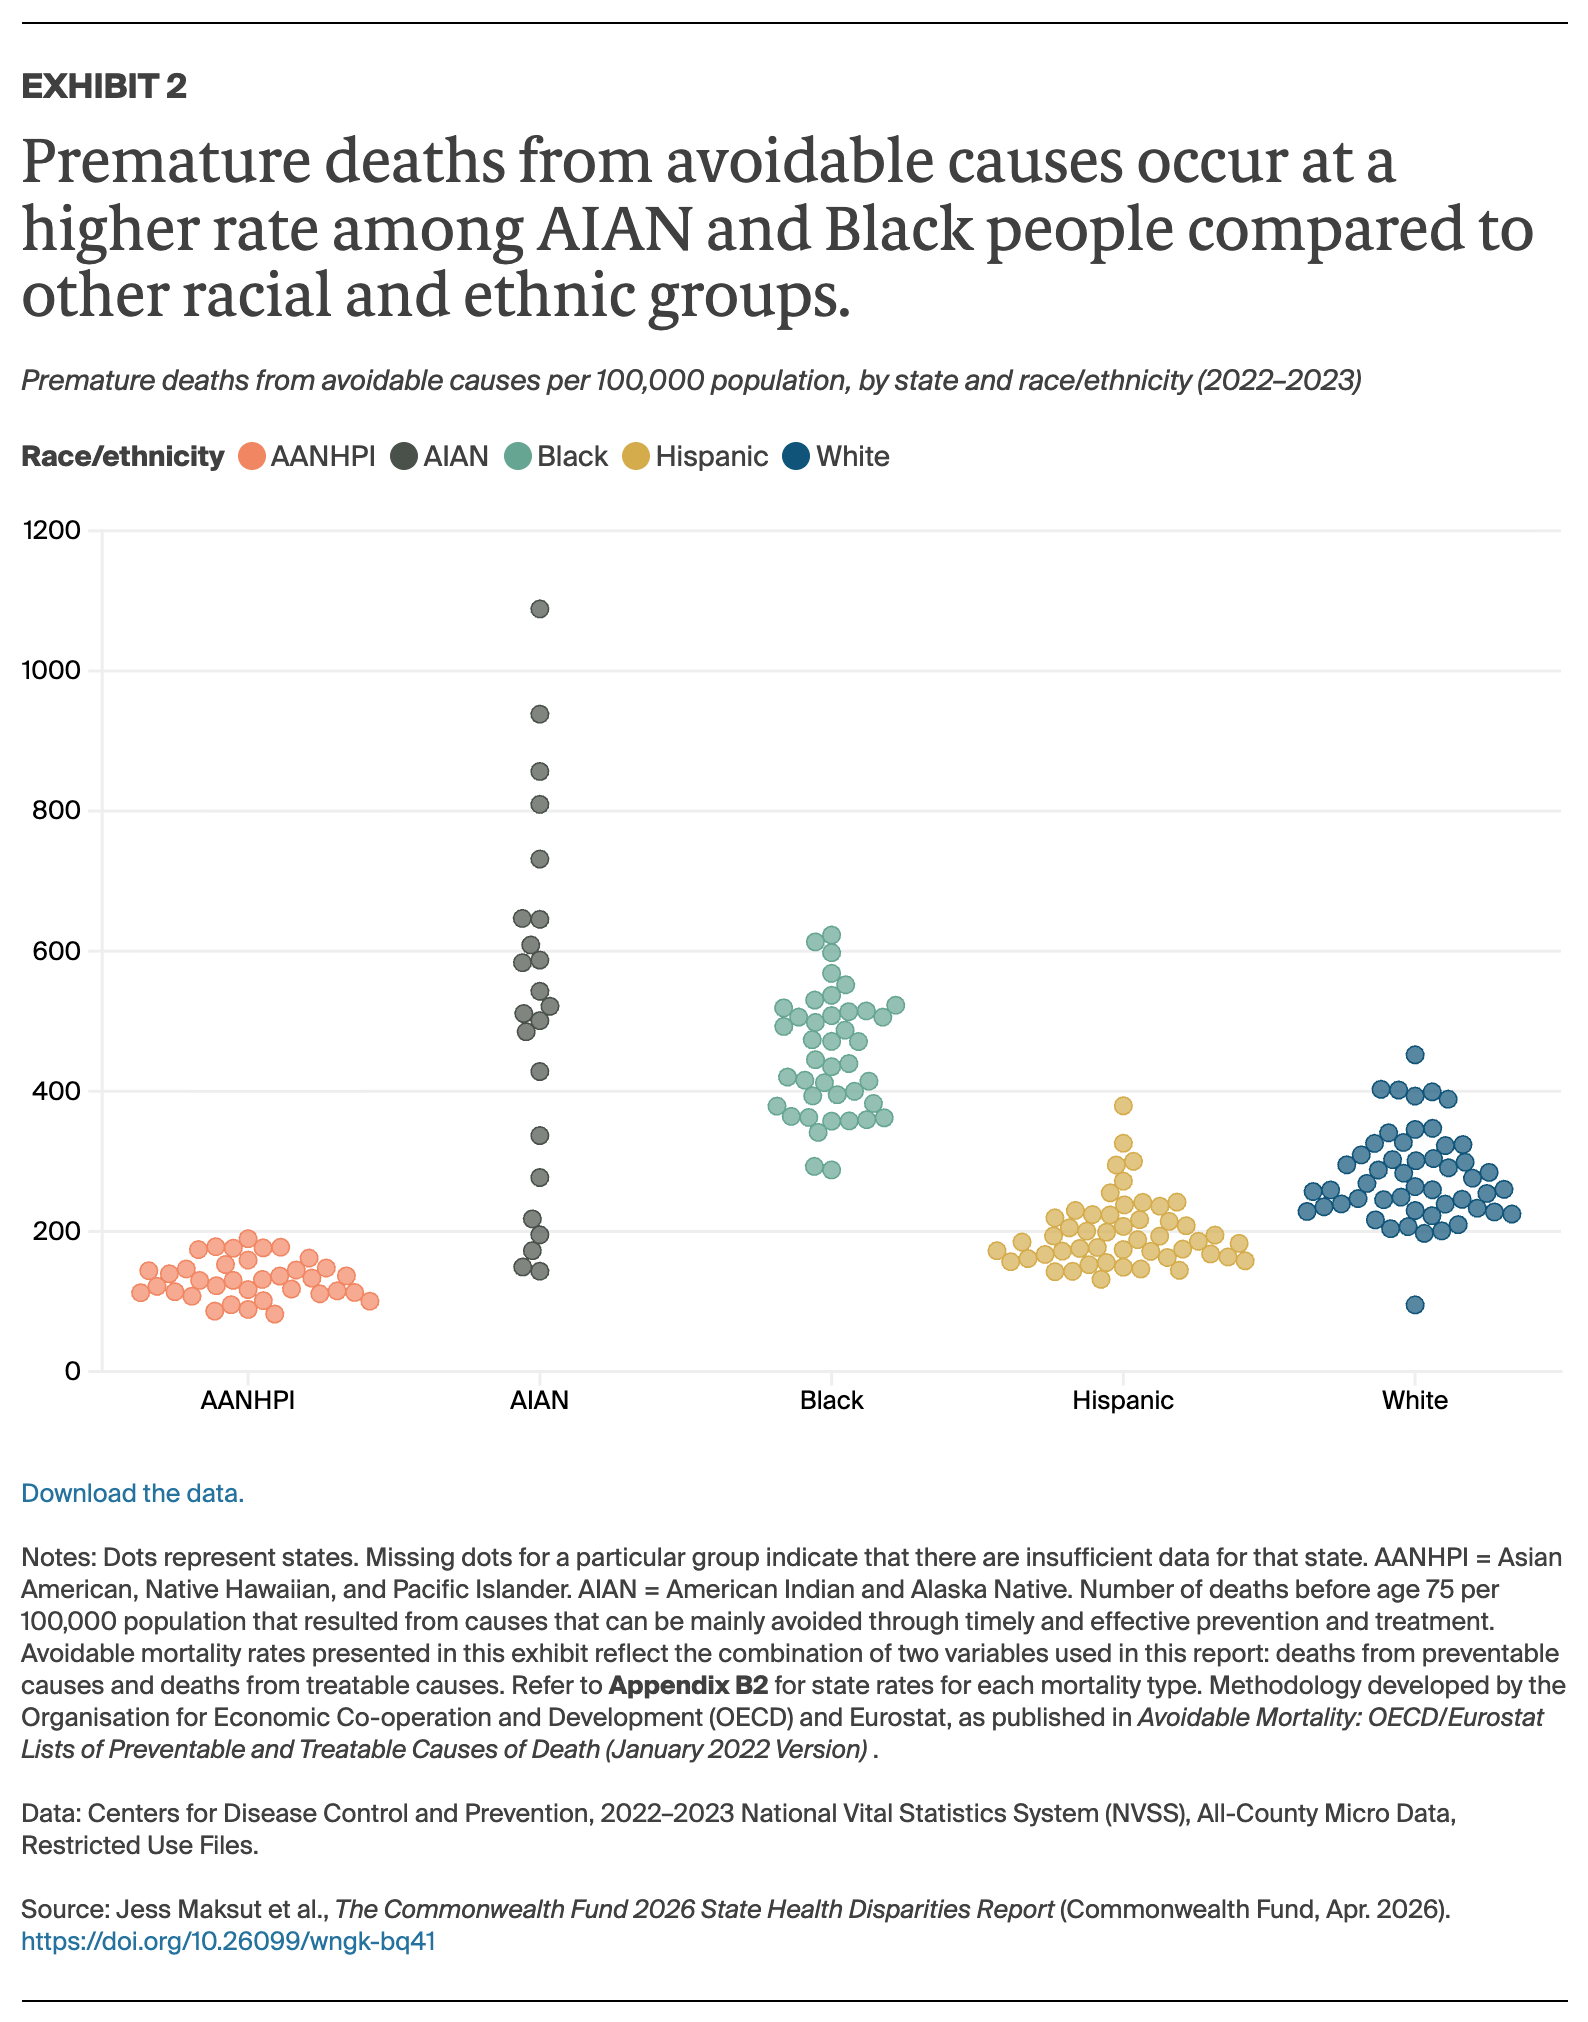
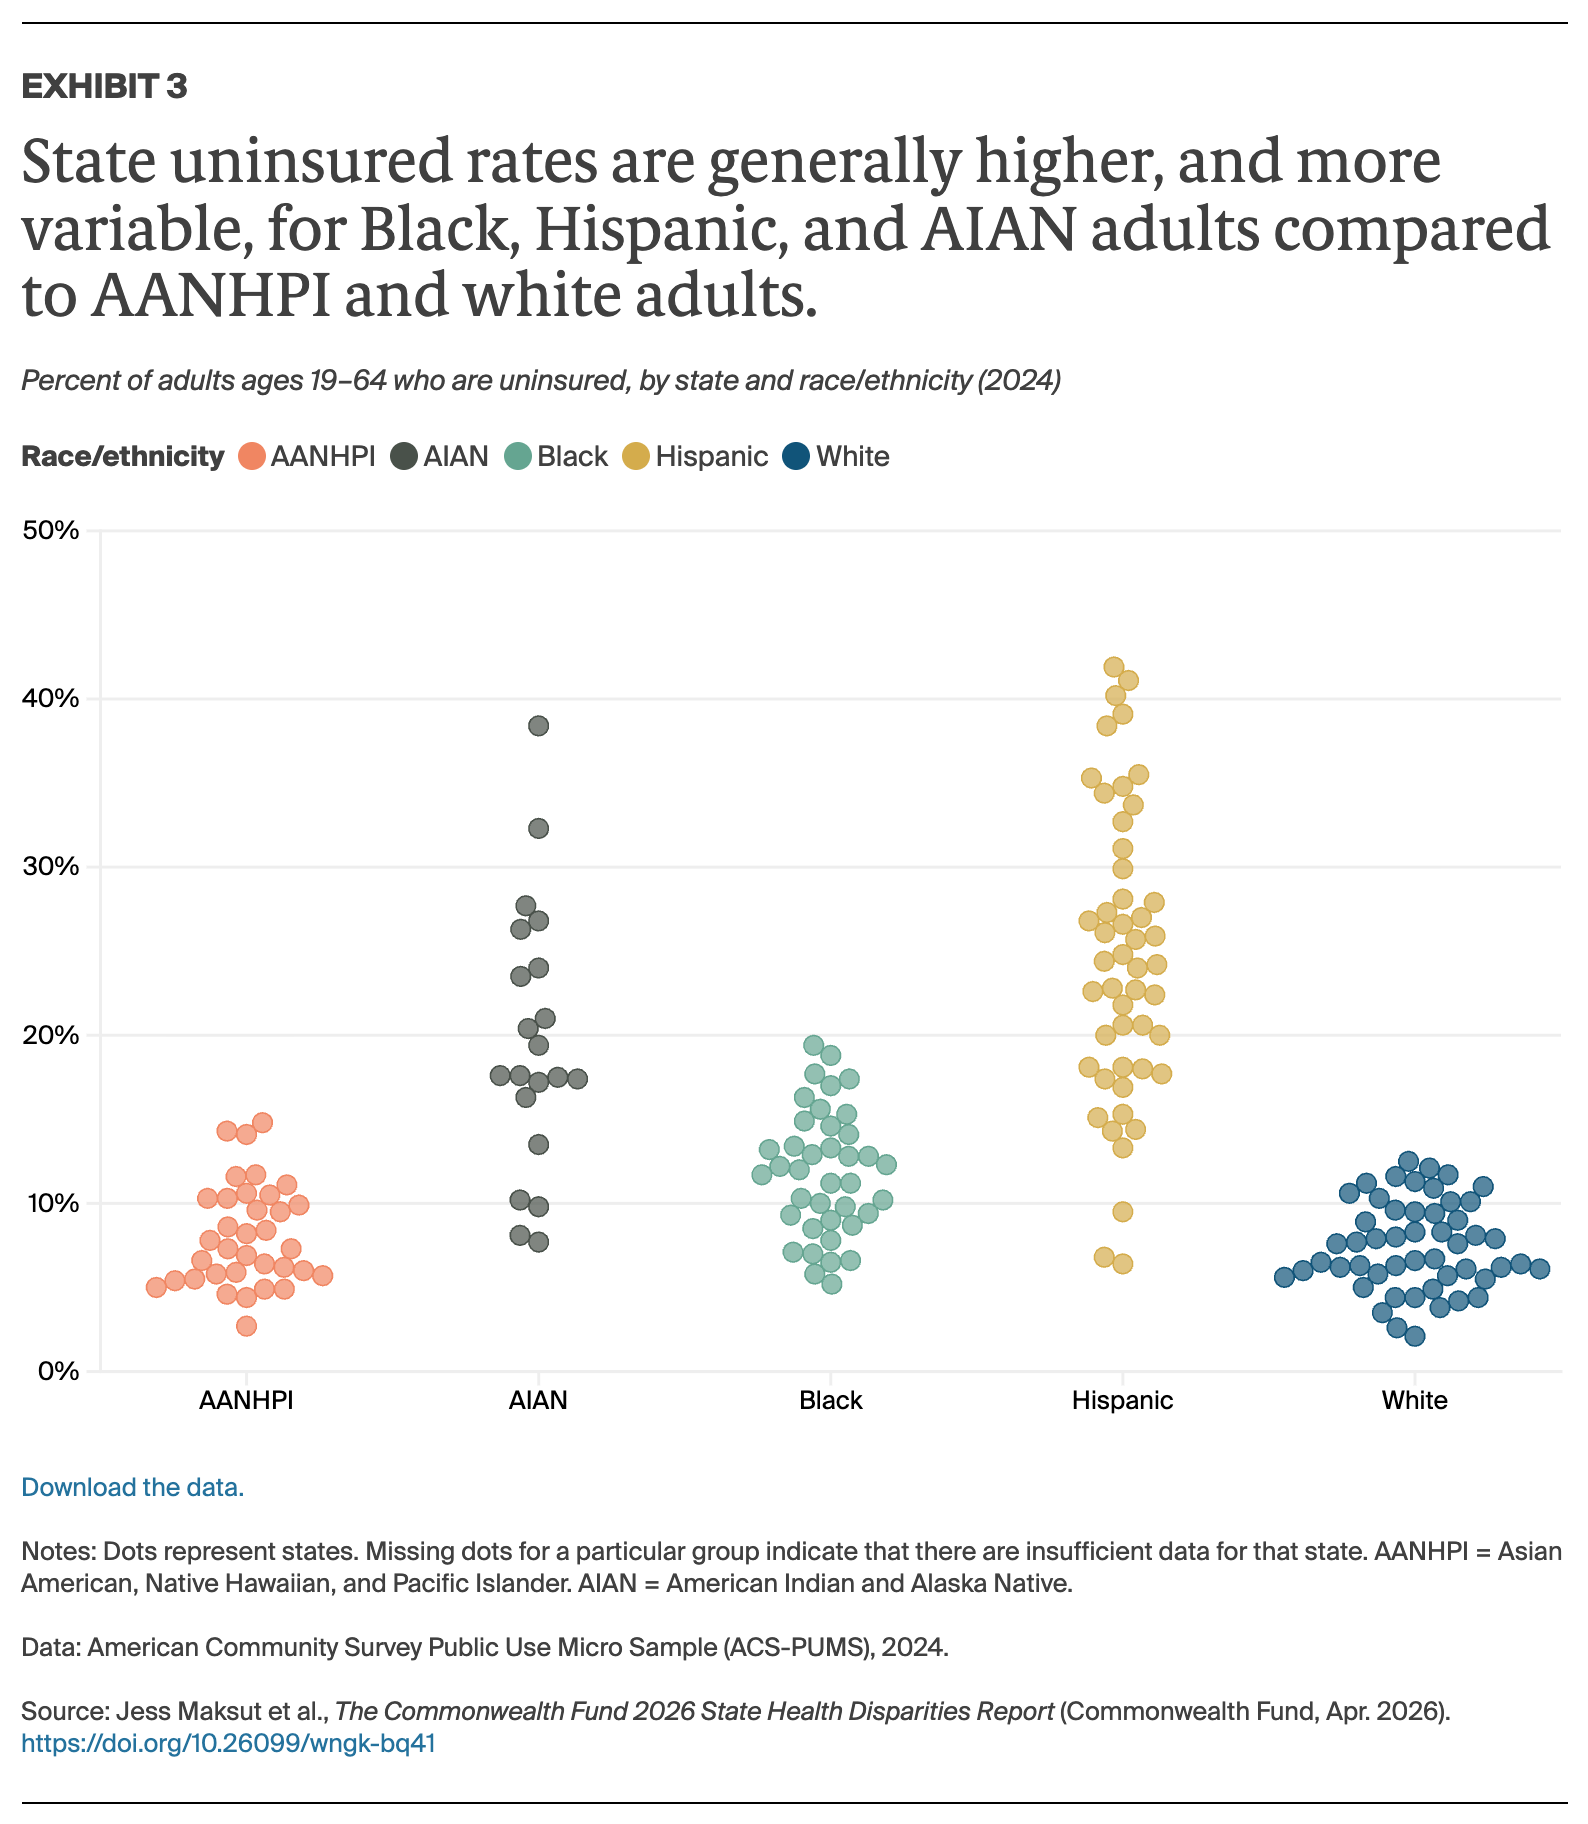
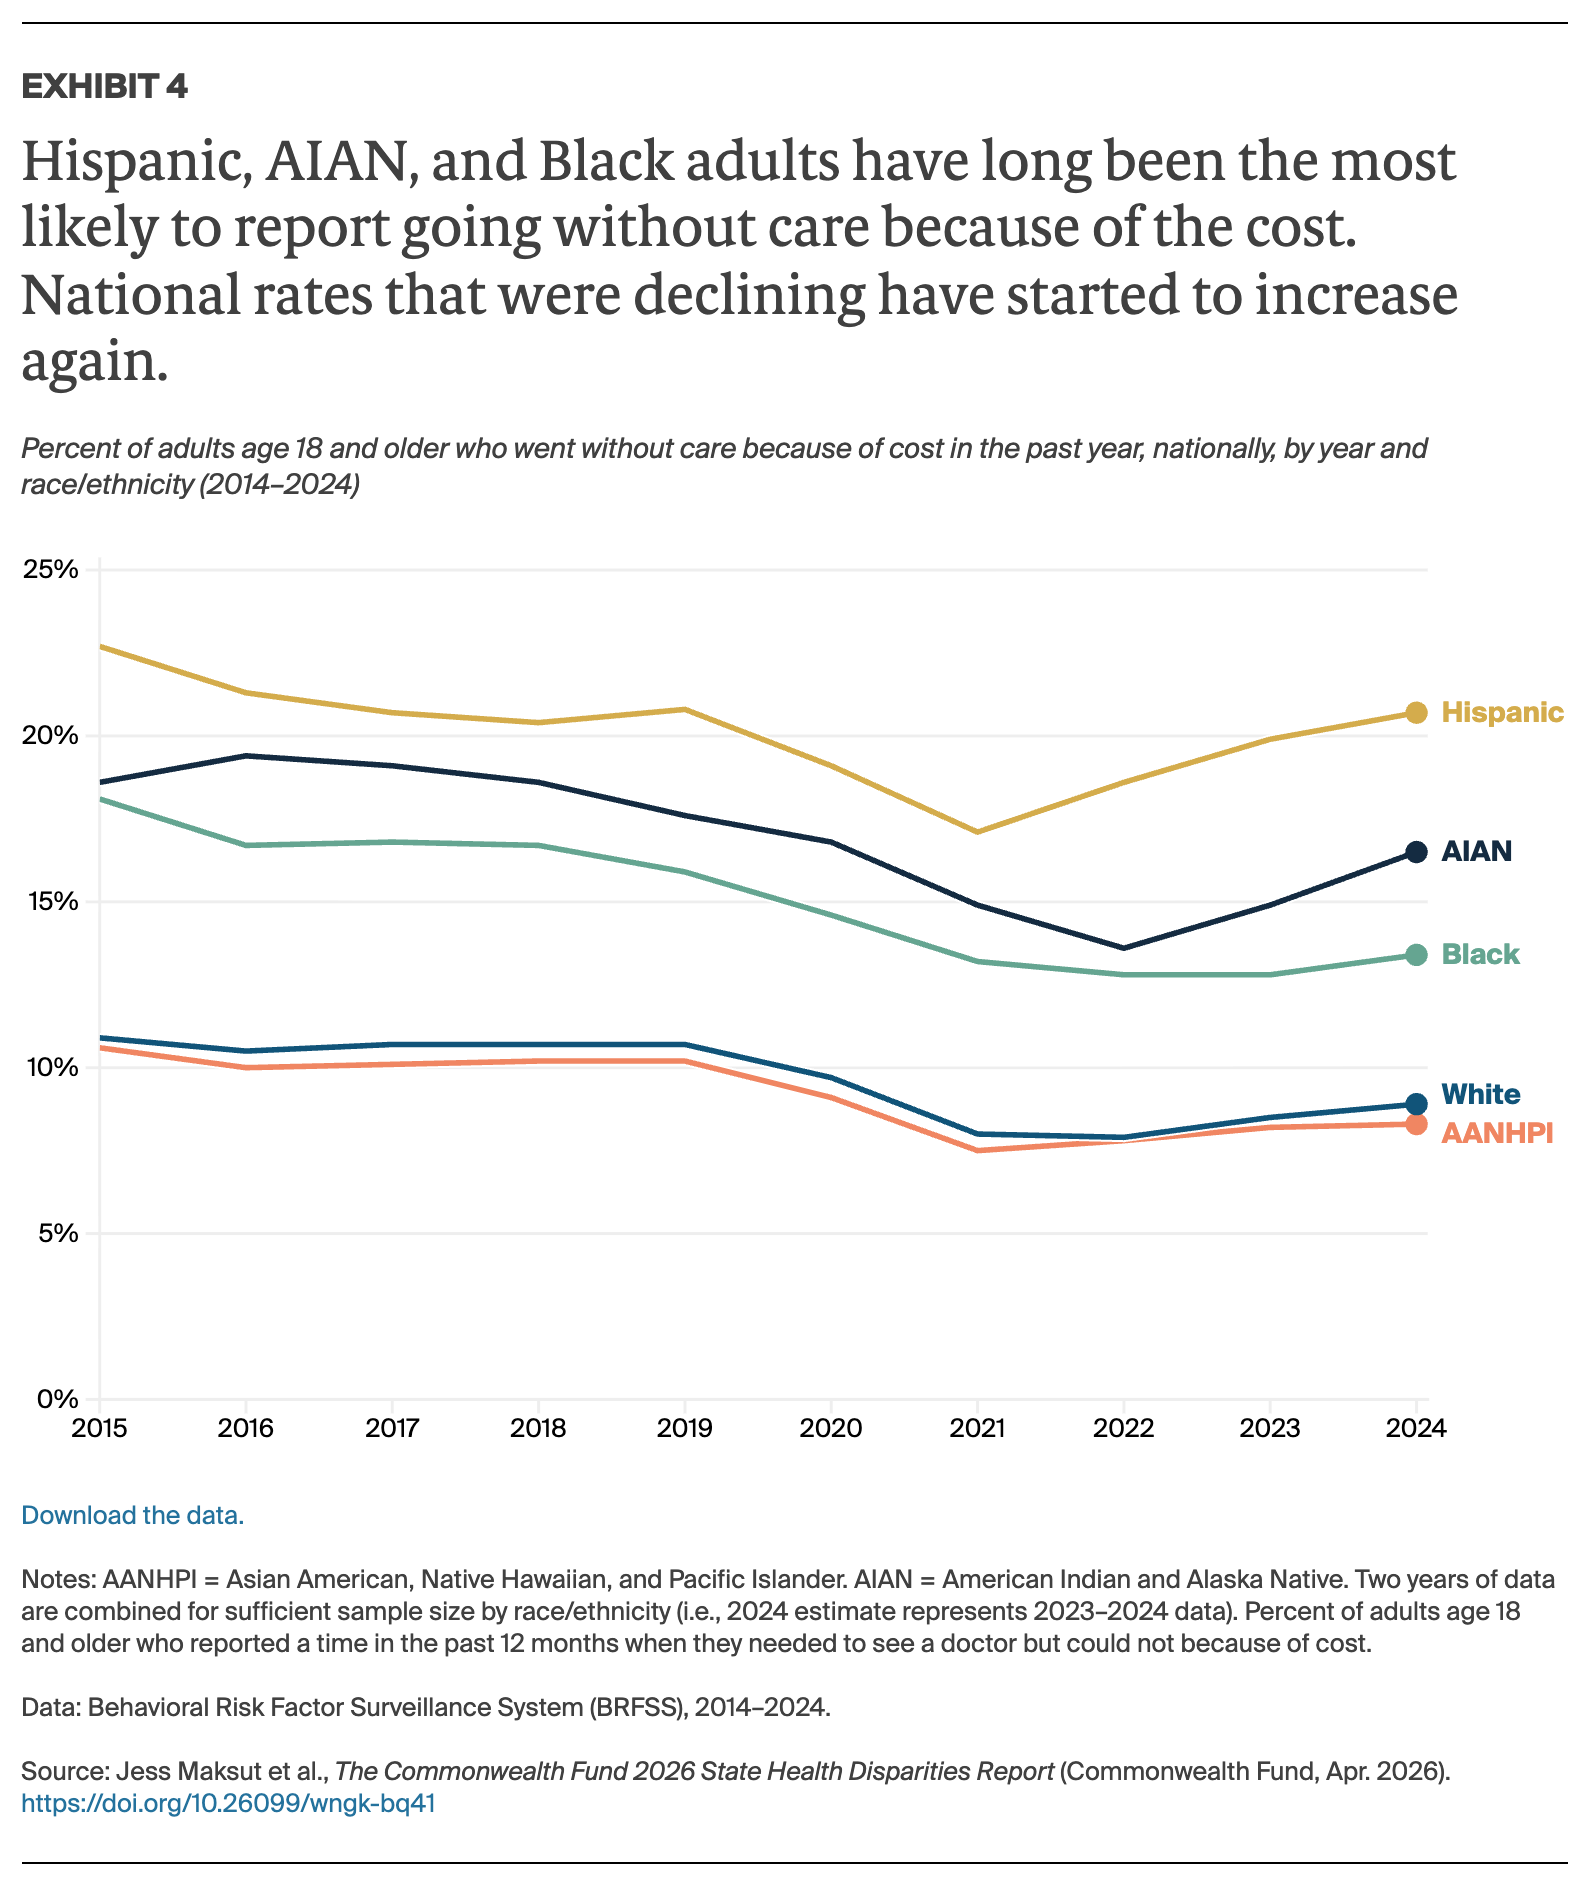
Overall, our findings show that health care in the United States continues to be unequally distributed, with racial and ethnic disparities in insurance coverage and access to high-quality care contributing to shorter, sicker lives for millions of Americans.1 As in earlier editions, we found that no state has eliminated these disparities, and sometimes stark differences persist between racial and ethnic groups.2

The period that this report covers, 2022 to 2024, saw significant gains in health coverage. North Carolina and South Dakota both expanded eligibility for Medicaid, as the majority of other states had already done; enrollment in Affordable Care Act (ACA) marketplace plans occurred at a record pace; and many state Medicaid programs extended postpartum coverage for mothers to one year.3

At the same time, there was a rollback of Medicaid coverage flexibilities adopted during the COVID-19 pandemic, and the policy of continuous Medicaid enrollment ended. These changes led to millions of Americans losing their coverage or experiencing new barriers to enrollment, effects borne disproportionately by Black and Hispanic people.4

Though not reflected in this report’s findings (owing to a lack of more current data), pronounced shifts in the national policy environment in 2025 and 2026 have likely worsened — and are on track to further exacerbate — existing racial and ethnic disparities in access, affordability, and outcomes. These include major federal funding cuts and changes to Medicaid and the ACA marketplaces; bans on eligibility for most legal immigrants and asylees; sweeping new regulations that are likely to reduce marketplace plan enrollment and increase patients’ out-of-pocket costs; and the expiration of enhanced premium tax credits, which had doubled enrollment in marketplace coverage.5

In addition, the Trump administration’s heightened immigration enforcement has caused many people, including citizens and those with lawful documentation, to avoid seeking care or participating in benefits for which they’re eligible.6 Many federal offices, positions, programs, and grants designed to advance health equity have also been eliminated.7 In this context, our findings highlight just how consequential states’ policy choices will be to people’s health in the years ahead.

Why Do We Focus on Race and Ethnicity?

While health disparities — differences in health outcomes, coverage, and quality of care — are also based on income, geography, and other factors, in this report we focus on race and ethnicity. That’s because racial disparities are among the most persistent and well documented in the U.S. health care system.8 Landmark studies have shown that racial and ethnic disparities remain even after accounting for insurance coverage, income level, and access to care. The root causes for these disparities are multifactorial, and include the historical and continued consequences of structural racism,9 the impact of social drivers of health, variations in health coverage, and unequal treatment within health care.10

The significant variation in states’ progress on health disparities is shaped by policy choices and health system investments in strategies known to improve access, quality, and outcomes for all people. In the findings that follow, the impact of state actions becomes clear.

A Note on the Racial and Ethnic Categories Used in This Report

Each of the five racial and ethnic groups in this report has diversity in culture, lived experiences, socioeconomic circumstances, and immigration-related challenges. Because these categories are broad, they may obscure important within-group differences, as illustrated by the substantial variation in life expectancy among Asian Americans, Native Hawaiians, and Pacific Islanders.11

To ensure adequate sample sizes for our analysis of state health system performance, it was necessary to group categories together. State and local stakeholders, therefore, should keep in mind their unique communities when interpreting our report’s findings.

Readers can refer to the appendices for complete study methods, list of indicators, and health system scores for each state’s racial and ethnic populations.

Findings

Overall Health System Performance by Race and Ethnicity

Maksut_2026_state_disparities_Exhibit_01_performance_scores_all

Health care system performance varies widely by race and ethnicity, both within states and between states (Exhibit 1). The overall health system “score” for each racial/ethnic group within a state represents the sum of the state’s results on health outcomes, access to care, the quality of care people receive, and people’s use of health services. Mirroring national patterns, nearly all states have substantial health and health care disparities between white and Black, Hispanic, and American Indian and Alaska Native (AIAN) communities.

Connecticut, Maryland, Massachusetts, New York, and Rhode Island stand out for their comparatively high performance across racial/ethnic groups. Still, even in these states there are enduring disparities in access, quality, and outcomes. Health systems in Arkansas, Mississippi, Oklahoma, and West Virginia perform particularly poorly across all racial/ethnic groups for which we were able to calculate overall performance scores.

Health Outcomes

Health outcomes, as measured primarily by death rates and the presence of certain chronic health conditions, differ significantly by race and ethnicity. A recent report from the U.S. Centers for Disease Control and Prevention (CDC) showed that while life expectancy in the United States hit an all-time high in 2024, mortality rates for Black people and American Indian and Alaska Native (AIAN) people far outpaced those for other groups.12

Maksut_2026_state_disparities_Exhibit_02_premature_deaths

In this report, we focus on avoidable, premature deaths — those occurring before age 75 from either preventable causes or conditions that are treatable, like appendicitis, diabetes, and certain cancers. This health measure is highly correlated with life expectancy.13

On average, Black people are more likely than Asian American, Native Hawaiian, and Pacific Islander (AANHPI), Hispanic, and white people to die early from avoidable causes (Exhibit 2). Of these groups, AANHPI people have the lowest average rate of premature death. (Additional information, including each racial and ethnic group’s national average, can be found in the appendices.)

Within every state where data are available, premature deaths were more common among Black people than for white, AANHPI, or Hispanic people.14 Of any group in any state, AIAN residents of South Dakota, Minnesota, North Dakota, Montana, Alaska, New Mexico, and Arizona had the highest rates.

Nationally, Hispanic people generally have lower premature mortality rates compared to Black or white people, despite having higher uninsured rates and worse access to health care than these groups. It is important to note that the U.S. Hispanic population is highly diverse, and health care access and outcomes for specific groups — such as people of Mexican or Cuban heritage — can vary significantly, particularly by immigration status.15 Lower rates of preventable, premature mortality also could stem from the lower average age of U.S. Hispanic populations compared to other groups, as well as their lower rates of risky health behaviors like smoking.16 Nevertheless, recent research shows that, over time, mortality rates and the prevalence of chronic conditions, such as colon cancer, are rising within Hispanic populations.17

Health Care Access

Across states, there are large disparities in health care access between white people and members of most other racial and ethnic groups. Hispanic people have the highest uninsured rates and cost-related problems getting care.

Having health insurance is essential for accessing health care. Since the Affordable Care Act became law in 2010, the number of people with insurance has climbed steadily, driving national uninsured rates to historic lows. Enhanced premium tax credits enacted during the COVID-19 pandemic and extended by Congress in 2022 significantly reduced enrollees’ premium contributions and doubled marketplace enrollment. In 2025, a record 24.2 million people enrolled in ACA marketplace plans.18

Recent policies, however, are eroding those coverage gains. States’ efforts to redetermine their residents’ eligibility for Medicaid following the pandemic — a process known as “unwinding” — led to a nearly 20 percent decline in program enrollment by late 2025 from its peak two years earlier.19 In addition, Congress failed to extend the enhanced premium tax credits for millions of middle- and lower-income Americans, increasing enrollees’ annual premium contributions by between $750 and $4,035, depending on their income.20 Many marketplace plan enrollees are expected to drop their coverage as a result.21 Finally, Congress and the Trump administration have barred millions of legal immigrants and asylees from the ACA marketplaces.22

These and other recent policy changes will disproportionally affect people with low and middle income and likely widen racial and ethnic disparities in peoples’ ability to get care.

Maksut_2026_state_disparities_Exhibit_03_uninsured_rates

There were widespread coverage disparities in 2024, the most recent year for which data are available for all states (Exhibit 3). In most states, uninsured rates continue to be higher for Black, Hispanic, and American Indian and Alaska Native (AIAN) residents than they are for white and Asian American, Native Hawaiian, and Pacific Islander (AANHPI) residents.

Maksut_2026_state_disparities_Exhibit_04_went_without_care
Maksut_2026_state_disparities_Exhibit_05_financial_barriers

When health services are not affordable, people are more likely to forgo needed care. The number of people reporting they skipped needed care because of costs has crept up in recent years, with rates climbing fastest for Hispanic and AIAN communities (Exhibit 4). Medicaid’s policy during the pandemic of keeping beneficiaries continuously enrolled, among other coverage enhancements, helped people with low income get and maintain coverage. In fact, the share of adults who said they skipped needed care hit all-time lows in 2021 and 2022. But these gains are eroding as coverage expansions are pulled back.

In 43 of the 50 states where data are available, Hispanic adults were the most likely to report going without care because of costs in 2024 (Appendix B3). AIAN and Black adults, meanwhile, had higher rates compared with AANHPI and white adults in most states (Exhibit 5).

Hispanic and AIAN adults were also the most likely to lack health insurance, and Hispanic adults in most states were the most likely to lack a usual source of care compared with other groups. Having a usual source of care, like a particular doctor’s office or clinic, is associated with use of preventive care services and better health outcomes.23

Immigrants are more likely to be uninsured and to report delays getting care than U.S.-born adults.24 These findings reflect the intertwined relationship of insurance coverage, affordability, and access to care. Policy changes made by Congress and the Trump administration in 2025 are likely to widen this disparity.

Quality and Use of Health Care Services

Maksut_2026_state_disparities_Exhibit_06_ preventive_care

In all but eight states, Black and Hispanic children were less likely to get recommended medical and dental preventive care than white children, defined as having at least one age-appropriate medical and dental visit in the past year (Exhibit 6). Rates varied considerably across states. More than nine in 10 Hispanic children in Vermont had timely preventive care visits, compared to only half of Hispanic children in Arkansas.

Preventive care is needed to monitor children’s growth and development, screen for physical or mental health issues, and administer recommended immunizations.25 Missing out on regular preventive care visits can put children’s long-term health at risk.26 Parents and caregivers report that the need to take time off from work, availability of appointments, transportation, and language issues are all challenges that contribute to missed preventive care visits.27

Children from Spanish-speaking households are less likely than children from English-speaking ones to have a recent preventive care visit and less likely to have a usual source of care.28 In addition, Spanish-speaking parents report dissatisfaction with the quality of communication with providers in their children’s medical care.

There are also disparities in the quality of pediatric care provided in various settings.29 For example, marked disparities exist in the quality of neonatal hospital care, with Hispanic and Black newborns more likely than white newborns to experience unexpected but potentially avoidable complications.30

Maksut_2026_state_disparities_Exhibit_07_childhood_vaccines

Our report tracks the share of children who receive all recommended doses of seven key early childhood vaccines that protect against serious illnesses such as measles, polio, and tetanus. While federal vaccine programs aimed at ensuring access to these vaccines have helped reduce racial and ethnic disparities, there is still room for improvement (Exhibit 7). For the combined seven-vaccine series, Black or Hispanic children had the highest vaccination rate relative to other groups in 21 states.

The federal Vaccines for Children program, which makes no-cost vaccinations available to children enrolled in Medicaid, those who are uninsured or underinsured, and American Indian and Alaska Native (AIAN) children, has helped to reduce disparities over time.31

Recent federal changes and current uncertainty about vaccine recommendations, such as eliminating the universal recommendation for the hepatitis B vaccine at birth, would likely lower vaccination rates.32 In addition, potential Trump administration changes to immunizations covered by the Vaccines for Children program and Medicaid could eliminate no-cost access to vaccines.33 This could reverse decades of progress in reducing disparities in childhood vaccination rates.

Maksut_2026_state_disparities_Exhibit_08_breast_cancer

Breast cancer is considered highly treatable when detected early. Current guidelines recommend that all women be screened every other year starting at age 40 and continuing through age 74.34

Black women get regular mammograms at comparatively high rates, ranging from 63 percent in New Hampshire to 96 percent in Utah. The range for white women was 68 percent in Wyoming to 88 percent in Rhode Island. Rates of timely completion of breast cancer screening for AIAN, AANHPI, and Hispanic women varied more widely. However, in 37 of the 40 states where data are available, Black women had the highest age-adjusted rate of dying from breast cancer compared with other groups (Exhibit 8).

What explains this apparent contradiction? For one, Black women are more likely to experience delays in follow-up testing after an abnormal mammogram and more likely to have breast cancer detected at a later stage, when treatment is less effective.35 Although ACA coverage provides breast cancer screening at no cost, follow-up testing, including additional imaging or biopsies, has not historically been free. The cost of obtaining these follow-up services has posed barriers to getting quality cancer treatment.36 Under updated preventive services guidelines, health insurance plans, as of January 2026, are required to cover necessary follow-up imaging or pathology at no cost.37

When receiving treatment for breast cancer, Black women are more likely to report negative financial impacts, like loss of a job, which can further interfere with treatment.38 They are also less likely to receive treatment that’s consistent with clinical guidelines.39

Discussion

Today, we know that across the U.S., health care access, quality, use, and outcomes vary widely by race and ethnicity, and that these disparities are present in all states. We also know that where people live and receive their care matters: both the baseline level of care and the size of disparities can differ substantially by location. These differences reflect variation not only in the delivery of health care and in state and local policy choices, but also in the social and economic conditions that shape health — as well as investment in efforts to address these drivers of health.40

The evidence presented in this and prior reports shows that states with stronger overall health system performance also tend to perform better on health equity.41 Health care and policy leaders can prioritize equity by using data to identify disparities and target the needs of people facing the greatest barriers.

State Choices Matter to Their Residents’ Social Well-Being

Health isn’t just a product of the quality of your medical care. In fact, “social drivers” of health like economic stability and access to safe housing can account for up to 80 percent of people’s health outcomes.42 States vary widely in what they do to influence the social conditions contributing to their residents’ health.43

Medicaid eligibility. As of 2026, all but 10 states have expanded Medicaid eligibility for adults earning up to 138 percent of the federal poverty level — about $21,600 in 2025 — as the Affordable Care Act allows.44 In states that chose to expand Medicaid coverage, racial disparities in preventable hospitalizations and emergency department visits decreased between Black and white adults.45

Medical debt. Debt from medical bills disproportionately burdens Black adults. It causes individuals and families to cut back on necessities like food or heating and creates psychological distress.46 A number of states have implemented policies to protect residents from medical debt, but the strength and enforcement of these policies vary.47 North Carolina partnered with hospital systems in an effort to ameliorate medical debt in 2024, forgiving debt for about 2.5 million state residents as of 2026 and putting in place protections to prevent future debt accumulation.48

Support for families, parents, and caregivers. Black and Hispanic women across states are less likely to have access to paid parental leave benefits relative to white women.49 With no federal paid parental leave policy in place in the U.S., an increasing number of states — 13 as of early 2026 — have implemented paid family and medical leave on their own.50 For example, New York has a program that is mandatory for employers, providing up to 12 weeks of paid, job-protected leave.51

Paid parental leave is associated with a variety of physical and mental health benefits for both infants and mothers. These include reduced postpartum depression, fewer rehospitalizations, and improved attendance at pediatric care visits.52

The rapid growth of digital tools, including artificial intelligence (AI), will increasingly shape whether people can navigate their coverage and care, get health information they understand, and stay connected to services. This especially matters to AIAN, Black, and Hispanic communities, whose members are more likely to lack insurance and to face cost-related barriers to care. Health system leaders must adopt and monitor digital solutions with equity in mind, or else the disparities this report documents are at risk of widening.

Although policies that expand affordable coverage and strengthen primary care are central to reducing health disparities, the health care delivery system also plays a big role. By embedding safety and quality in everyday operations — examining outcomes and service use across different patient populations, assigning clear leadership responsibility for equity, and investing in workforce training that reflects community needs — health care organizations can ensure that resources are used effectively and fairly and that everyone gets better care.53 Accreditation can further reinforce organizational accountability and signal commitment, such as through the Excellent Health Outcomes for All and Community-Focused Care certification programs.54

Declining federal support for data collection and reporting by race and ethnicity threatens to obscure disparities in health outcomes and system performance, undermining efforts to allocate resources equitably. Reports like ours underscore the continued importance of this information for tracking racial and ethnic differences in care across states.55

What Policy Changes Are Needed to Bridge the Gap?

Through targeted actions, policymakers and health system leaders can improve access to affordable, high‑quality health care while addressing the social and economic drivers that contribute to persistent racial and ethnic health disparities. Here are some options for state and federal policymakers to consider.

Ensure affordable, equitable health coverage for everyone. Nearly 27 million people in the United States were estimated to be uninsured in 2025, with rates disproportionately high for people who are American Indian and Alaska Native, Black, and Hispanic.56 The number of uninsured is projected to surge to 37 million by 2036 due to tightened Medicaid eligibility, changes to enrollment processes, and the loss of enhanced Affordable Care Act plan subsidies.57 There are many steps Congress and states could take to counter these impacts:

  • Congress could strengthen ACA marketplace coverage by permanently extending the enhanced premium tax credits and reducing deductibles and other out-of-pocket costs.
  • Congress could amend H.R. 1, last year’s tax and spending law, or enact new legislation to reduce the administrative barriers that prevent many eligible adults from enrolling in Medicaid or marketplace coverage. In the absence of congressional action, states could maximize automatic coverage renewals by using administrative data, limiting reporting frequency for work requirements, and requiring timely communication of renewal notices.58
  • The 10 states that have not yet expanded Medicaid eligibility could do so. Short of that, Congress could fill the Medicaid coverage gap by expanding eligibility for marketplace coverage for people living below the federal poverty level.59
  • Congress could reverse recent restrictions and allow legal immigrants and asylees to enroll in Medicaid or subsidized marketplace coverage.60 In addition, federal lawmakers could build on the steps that New York, Oregon, Washington, Minnesota, and Colorado have taken to expand access to coverage.61

Strengthen primary care and improve the delivery of services. Communities that are predominantly Black and Hispanic tend to have fewer primary care providers and lower-quality health care facilities than those that are mostly white.62 To diminish these disparities, federal and state policymakers could:

  • Reimburse primary care providers based on the value of care they deliver to patients. Doing so would encourage investment in health promotion, disease prevention, and chronic disease management.63
  • Offer financial incentives, such as higher reimbursement rates or loan repayment, to providers that serve medically underserved communities.
  • Expand training for community health workers and make them part of the care team. These workers can help by arranging interpretation and translation services, providing culturally appropriate health education and information, and helping people navigate the health system to get the care they need.64
  • Strengthen pipelines into the health professions for people across racial and ethnic backgrounds and chronicle the impact of policies on diversity in health care.65
  • Modernize medical licensing to allow health care professionals to practice across state lines.66

Protect access to preventive care. Getting recommended preventive care helps people identify or lessen the risk of serious health conditions, like cancer and stroke. Missed preventive care contributes to health disparities.67 To support access to preventive services, state and federal policymakers could:

  • Adopt evidence-based recommendations, including support for universal access to vaccines.68 Recent modifications to federal guidelines, such as eliminating the recommendation for all infants to get the hepatitis B vaccine at birth, are likely to increase rates of vaccine-preventable liver disease. A March 2026 federal district court ruling has temporarily blocked these changes, but the Trump administration could appeal.69 The upheaval surrounding vaccine recommendations underscores the need for vaccine policy that is firmly grounded in science to protect public health.
  • Ensure preventive services recommendations are kept up to date. Under the ACA, all public and private insurers must cover, without cost sharing, key preventive services recommended by the U.S. Preventive Services Task Force — but this committee has not convened in over a year.70
  • Protect no-cost access to cancer screenings and other vital preventive services. Even small out-of-pocket costs can deter people from seeking care and worsen health disparities, since these costs place greater burdens on people with few economic resources.71

Address health-related social needs. Compared with other high-income nations, the U.S. spends far less on social services and other protections that buffer individuals and families against economic insecurity. Social drivers of health account for as much as 80 percent of health outcomes.72 By strengthening economic and social supports, federal and state lawmakers can help people meet their essential needs and reduce downstream health risks. This could be done by expanding or improving access to:

  • Unemployment benefits, state earned income tax credits that supplement the federal credit, and child tax credits.
  • Supplemental Nutrition Assistance Program (SNAP) benefits, childcare subsidies, and early childhood development programs like universal pre-K.
  • Targeted wealth- and asset-building programs such as “baby bonds.”73
  • Affordable housing, transportation, and higher education.

Ensure the design and implementation of equitable digital health innovations. Our findings show persistent racial and ethnic gaps in access, quality and use of health care services, and health outcomes — and wide variation across states in how well health systems perform for different populations. Digital health tools, including some AI-based tools, have the potential to help close these gaps by streamlining administrative workflows, supporting care coordination, and making services and information easier for patients to access and navigate. For example, AI can be used to improve patient–provider communication by making health information more accessible or easier for patients to understand.74

Health AI: Opportunities and Risks for Equity

Across the United States, health care organizations are rapidly adopting artificial intelligence (AI)-enabled health care tools to address workforce shortages, ease administrative burdens, and improve access to care.75 However, these tools can also amplify existing disparities if they’re designed, deployed, or governed without attention to potential bias, transparency, or accountability.76 With no comprehensive federal framework in place, states will play a central role in determining whether health AI helps close gaps in care or allows them to widen.

In early 2026, Utah launched a partnership with Doctronic, whose AI system supports automated prescription renewals for certain medications. The goal is to reduce delays, support medication adherence, particularly those who face barriers to timely primary care.77 Notably, AIAN, NHPI, Black, and Hispanic Utahans have historically had worse primary care than white residents.78

Colorado enacted legislation in 2021 prohibiting insurers from using algorithms or predictive models that discriminate against patients based on protected characteristics like race and ethnicity.79 Starting in June 2026, those developing and deploying high-risk AI applications, such as health insurers, must conduct impact assessments, notify people of AI-generated “consequential decisions,” provide appeal rights, and allow individuals to opt out of AI-driven “profiling” that could affect their access to insurance or health care services.

Colorado’s legal protections have significant equity implications: claim denials are generally more common among members of underserved racial and ethnic groups, and increased denials due to automated decision-making and AI-driven “profiling” may disproportionately affect communities that have fewer resources to appeal such denials.80

Additional information about state laws on the use of AI in health care is available here.

The impact of these technologies, however, depends largely on the problems they are designed to solve. For example, AI has potential to help tackle longstanding challenges to optimal care coordination, patient experience, and health outcomes and to address health disparities.81 But research points to bias in the algorithms that drive these tools.82 Moreover, despite the risks to patients associated with poorly implemented or monitored AI tools, most states have not established explicit requirements governing the equitable design, procurement, and use of AI in health care.

To ensure digital innovation improves care and centers all patients, policymakers and health system leaders could:

  • Establish equity safeguards for patients, including rules for transparent use of AI in health care applications, setting standards for algorithmic fairness, establishing clear accountability for discriminatory impacts, and preserving human review and appeal pathways for automated coverage, eligibility, and payment decisions.
  • Strengthen health systems’ capacity to adopt and manage responsible digital tools by investing in technical assistance, workforce training, and implementation support, particularly for safety-net health systems, and identify use cases for digital tools that are effective in these systems.
  • Bring together safety-net health care providers, researchers, technology developers, and public agencies to ensure the responsible adoption of AI tools that improve quality and outcomes for the groups most affected by health disparities.83
How We Measure Performance of States’ Health Care Systems for Racial and Ethnic Groups

Our measurement strategy was designed to produce a state health system performance score for each of five racial and ethnic groups in every state where direct comparisons are possible among those groups and among groups in other states. The five groups are: Black, white, Hispanic, American Indian and Alaska Native (AIAN), and Asian American, Native Hawaiian, and Pacific Islander (AANHPI).

We started by collecting data for 24 performance indicators, stratified by state and by race and ethnicity. Indicators were grouped into three domains: health outcomes, health care access, and quality and use of health care services.

Scoring method. For each of the 24 indicators, we calculate a standardized score for each state or population group with sufficient data. As an example, for adult uninsured rates, we calculate standardized scores using point estimates for 195 state racial and ethnic group pairs (e.g., 51 white, 49 Hispanic, 39 Black, 35 AANHPI, 21 AIAN) with sufficient data.

Within each performance domain, we combined indicator values to create a summary score. We then combined the domain summary scores in each state to create a composite state health system performance score for each racial and ethnic group — Black, white, AIAN, and AANHPI (non-Hispanic), and Hispanic (any race). The ability to generate these scores depends on having a sufficient population sample size for each indicator.

Based on the totality of composite scores, each racial or ethnic group within each state received a percentile score providing both national and state-level context on the performance of a state health system for that population. The percentile scoring, from 1 (worst) to 100 (best), reflects the observed distribution of health system performance for all groups measured in this report and enables comparisons within and across states. It is important to note that because scores are set relative to one another rather than to a predefined benchmark, there is still room for improvement in health system performance at or near the 100th percentile.

Use of racial/ethnic data categories. The five racial and ethnic data categories often group together populations with different experiences, cultures, immigration barriers, and other socioeconomic factors. This includes a wide range of culturally distinct Hispanic communities and Asian American communities. Such groupings are imperfect, as they mask significant differences. For example, past research has shown variability in health insurance coverage rates among Asian American subpopulations and between Asian Americans and Native Hawaiians or Pacific Islanders.84

These categories are necessary, however, because they reflect the ways that populations are grouped in the data sources we drew upon for this report, and because our analysis required sufficient sample sizes. States and localities should interpret the findings within the context of their own communities, using them as a starting point to help guide more targeted research and policy solutions.

Refer to the appendices for complete study methods, list of indicators, and health system performance scores for each state and racial and ethnic population.

Acknowledgments

We are deeply thankful to the researchers who developed the indicators used in this report and to those who conducted data analysis, including Caitlin M. Burbank, Ph.D., P.T., D.P.T., from the Center for Evidence-Based Policy at Oregon Health and Science University, and Sherry A. Glied, Ph.D., Dong Ding, M.A., and Olivia Chan, M.P.A., at the New York University Robert F. Wagner Graduate School of Public Service. We thank Alison Barkoff, J.D., of George Washington University for her guidance and feedback.

We also thank the four-member advisory panel that provided crucial feedback and review throughout the development of the methods used in the first edition of this report: Cara James, Ph.D. (Grantmakers In Health), Zinzi Bailey, Sc.D., M.S.P.H. (University of Miami Miller School of Medicine), Dolores Acevedo-Garcia, Ph.D., M.P.A.-U.R.P. (Brandeis University), and Marc Elliott, Ph.D., M.A. (RAND Corporation).

Additionally, we would like to thank the Commonwealth Fund’s Joseph Betancourt, Rachel Nuzum, Tony Shih, Melinda Abrams, and Arnav Shah for their feedback and guidance, which strengthened this report. We are also grateful to the Fund’s communications, research, and support teams, including Chris Hollander, Aishu Balaji, Jen Wilson, Sam Chase, Bethanne Fox, Paul Frame, Josh Tallman, Barry Scholl, Avni Gupta, Carson Richards, Arnav Shah, Claire Coen, Karina Polanco, and Celli Horstman, for their editorial, production, and public dissemination support.

Finally, we wish to acknowledge Maya Brod and Gabrielle O’Brien of Burness for their assistance with media outreach.

Notes

Publication Details

Date

Contact

Jess Maksut, Director, Health Equity Research, The Commonwealth Fund

jmaksut@cmwf.org

Citation

Jess Maksut et al., The Commonwealth Fund 2026 State Health Disparities Report (Commonwealth Fund, Apr. 2026). https://doi.org/10.26099/wngk-bq41