Australia’s publicly funded health care system, Medicare, provides coverage to all Australian and New Zealand citizens, permanent residents, and individuals whose countries have reciprocal agreements with the Australian government. Established in 1984, the system is primarily funded through general taxation and an income-based levy.
Medicare offers full and partial coverage for many services, but not all, which often results in patients purchasing private insurance or paying out of pocket. While outcomes such as life expectancy are comparable to those in other high-income countries, health care spending is slightly higher.
Workforce shortages, rising costs, and disparities in access (especially for First Nations people and rural communities) present ongoing challenges. Reforms introduced since 2020 aim to improve service integration, expand digital health adoption, and make long-term care more affordable.
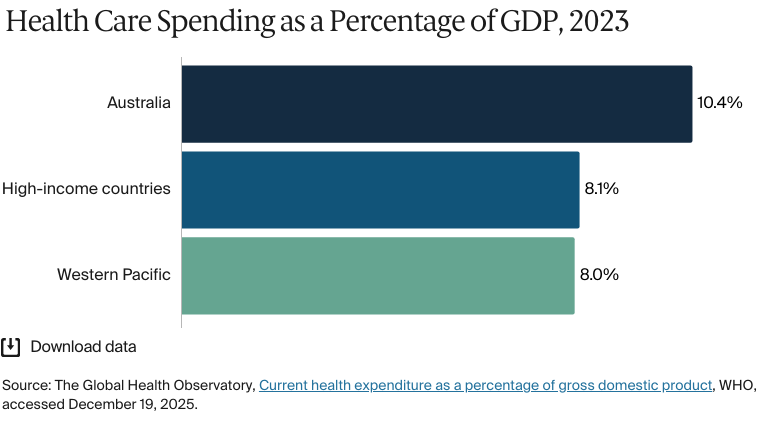
10 percent of gross domestic product spent on health care in 2023 (compared with 8% across high-income countries in 2023)1
442 doctors per 100,000 people in 2022 (compared with 232 across the Western Pacific region)2
252 public hospital beds for every 100,000 people in 2023–24.3
Australia’s publicly funded health care system, Medicare, provides coverage to all Australian and New Zealand citizens, permanent residents, and individuals whose countries have reciprocal agreements with the Australian government. Some migrants, refugees and humanitarian entrants also have access to Medicare, depending on their visa. Others must obtain private health insurance. Medicare covers all or part of most medical treatments.
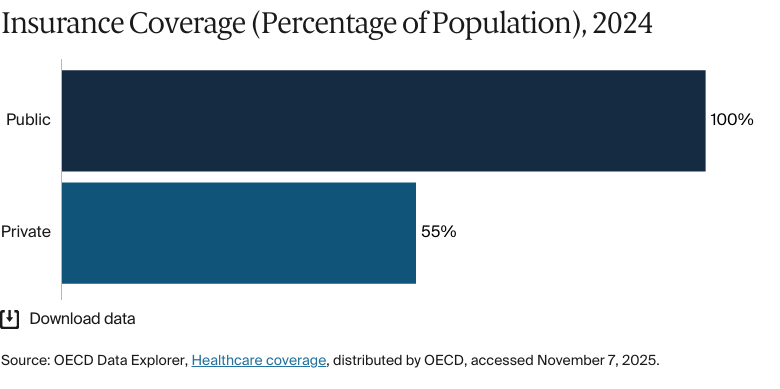
Public insurance coverage: 100% of population
Private insurance coverage: 55% of population
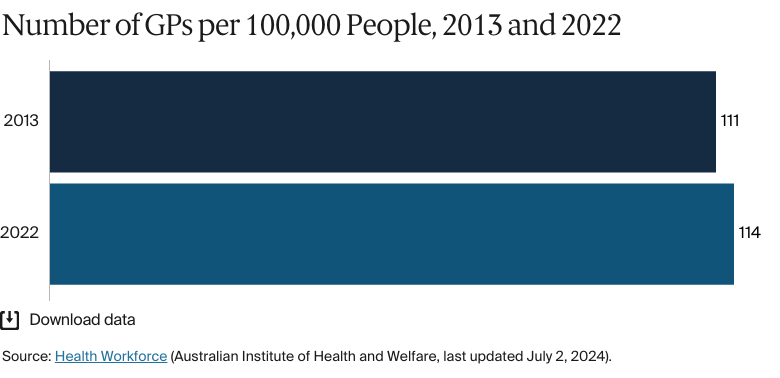
Primary care physicians: 114 per 100,000 people
Specialist physicians: 149 per 100,000 people
In 2023-24, government spending accounted for 74 percent of total health expenditure.
Pharmaceutical spending: 12.1% of total health care budget
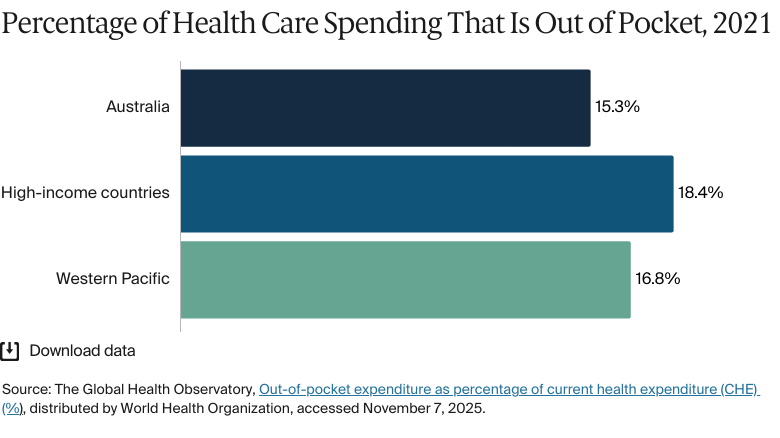
Out of pocket spending: 15.3% of total health care spend
Health inequities in Australia disproportionately affect low-income individuals, people in remote areas, and First Nations people — groups that often overlap and face similar barriers to care.
Health care access is a major challenge for remote communities. First Nations people, who make up 32 percent of remote and very remote populations, die at rates far higher than non-Indigenous population and live, on average, eight years less than non-Indigenous people; this gap was 12 years in remote and very remote areas.
In 1975, Australia introduced its first public health care system, Medibank, under the Whitlam Labor government. The aim of Medibank was to provide universal, equitable coverage. Although initially proposed as a levy-funded model, it was launched using general revenue.
Soon after, the Whitlam government was dismissed and replaced by the Fraser-led Liberal–National coalition, which opposed universal health care. In 1976, this coalition government created Medibank Private, marking the government’s entry into private health insurance. It also reorganized the public Medibank program to create Medibank Mark II. This new version was funded by a 2.5 percent income levy, with an opt-out for those who chose to use private insurance.4
The reforms drew strong criticism and sparked the 1976 Medibank strike, one of Australia’s only general strikes and among the largest in its history.5 Despite such opposition, however, Medibank was steadily wound back and, by 1981, the universal model had been dismantled.
In 1984, the Hawke Labor government reinstated a universal health care model, Medicare, which was funded by a 1 percent income levy and general taxation.6
The Role of Public Health Insurance
Medicare is available to all Australian and New Zealand citizens, permanent residents of Australia, and citizens of countries that have reciprocal agreements with the Australian government, including Belgium, Finland, Italy, Malta, the Netherlands, New Zealand, Norway, the Republic of Ireland, Slovenia, Sweden, and the U.K.7 Some migrants, refugees, and humanitarian entrants also have access to Medicare, depending on their visa status.8 Others must obtain private health insurance.9
Medicare covers all or part of most medical treatments. If a doctor “bulk bills” (a system whereby doctors bill Medicare directly), there are no out-of-pocket costs for the patient. The proportion of doctors who bulk bill varies according to state or territory; over recent years, the average national rate of doctors doing so has gradually declined. As of October 2024, the annual bulk-billing rate ranged from 53.2 percent in the Australian Capital Territory to 82.2 percent in New South Wales.10
In cases where a doctor does not bulk bill, patients either pay the full cost of treatments and claim Medicare benefits via Services Australia or only pay the difference between the doctor’s fee and the Medicare benefit.11
How Medicare Benefits Work
Medicare benefits are based on the Medicare Benefits Schedule (MBS), which sets the government’s recommended fee (the schedule fee) for each service. Medicare covers:12
100 percent of the schedule fee for GP visits and certain services by nurses and Aboriginal and Torres Strait Islander (First Nations) health practitioners
85 percent for most out-of-hospital specialist services
75 percent for private hospital treatments.
Patients will then pay out-of-pocket gap expenses to cover any remaining costs. For example, if a specialist appointment is AUD 200 (USD 132), and Medicare covers 85 percent of the cost, then the patient will pay the remaining AUD 30 (USD 20). Patients with high out-of-pocket medical costs may be eligible for increased benefits if their expenses exceed a certain threshold (see Safety Nets).13
Medicare covers the full cost of public hospital services and some of the costs of other health services. For instance, most medicines are subsidized under the Pharmaceutical Benefits Scheme (PBS) for anyone covered by Medicare (see Pharmaceutical Spending).14
If you have an emergency — say, you’re hit by a car — you go to a public hospital, and you won’t pay anything. You can stay six weeks or six months, and it’s all free.
Dr. Elizabeth Deveny
Chief Executive Officer
Consumers Health Forum of Australia
Certain services, such as dental care and emergency transportation, are not covered by Medicare and are largely privately funded. In some localities, emergency transportation is covered by the state, territory, or local government.15
Mental health care (patients can claim 10 sessions with a mental health professional each year)
Palliative care (Medicare covers most costs, but home care might incur additional expenses)
Long-term care (government subsidies support home and some residential care through various programs)
Rehabilitative care
Home visits.
Services that are not typically covered include:17
Dental care
Eye care (eye tests are covered, but glasses and contact lenses are not)
Assistive devices (coverage might be possible through programs such as the National Disability Insurance Scheme)
Ambulance services.
Safety Nets
Medicare safety nets help people with high out-of-pocket medical costs for MBS-listed outpatient services. Patients are eligible once their expenses exceed a certain threshold (which is annually adjusted based on the consumer price index).18
The Greatest Permissible Gap (GPG) controls out-of-pocket costs for certain specialist Medicare services by setting a cap on the difference between the MBS fee for a service and the 85 percent paid for by the Medicare benefit. When the MBS fee surpasses the GPG cap, Medicare will cover more than 85 percent of the cost. The GPG is adjusted annually for inflation; as at November 1, 2025, it was AUD 105 (USD 69).19 This means that a patient would pay either AUD 105 (USD 69) or 15 percent of the MBS fee, whichever is lower.
The Original Medicare Safety Net (OMSN) covers these gap expenses (see The Role of Public Health Insurance). Under the OMSN, once the amount paid in gap expenses exceeds the annual threshold (set at AUD 576 [USD 380] in 2025), Medicare reimburses 100 percent, instead of the usual 85 percent, of the schedule fee for any further outpatient care under the MBS.
Note that providers can still charge above the schedule fee. For example, the MBS fee for a service might be AUD 500 (USD 330), while a provider charges AUD 700 (USD 462). This misalignment is usually due to a difference between the MBS fee and the real cost of treatment. It can be attributable to factors such as rising costs or the complexity of care.20 These discrepancies can also occur when clinics charge a premium for in-demand services or specialists. In such cases, patients will usually have to pay out of pocket to cover the full cost of treatment.21
However, out-of-pocket expenses are partially covered by the Extended Medicare Safety Net (EMSN). Once they reach the annual threshold (set at AUD 2,616 [USD 1,725] in 2025), Medicare will cover 80 percent of any additional out-of-pocket costs for eligible outpatient medical care under the MBS.22
The OMSN and EMSN are available to all patients enrolled in Medicare, but the threshold for the EMSN varies. For example, concession cardholders (including pensioners and low-income earners) and families receiving specific tax benefits have a lower threshold, meaning they can receive the benefit after spending a lesser amount out of pocket.23
The Role of Private Health Insurance
Private health insurance covers treatment in public or private hospitals as a private patient. It pays for health services that aren’t included under Medicare, such as dental care and ambulance services.24 Only registered health insurers can offer private health insurance.25
Coverage is usually divided into hospital cover, extras cover, and ambulance cover. Hospital cover funds private hospital treatment, while extras cover applies to outpatient services that are not covered by Medicare. Legally, private insurers can’t cover Medicare-funded outpatient services such as general practitioner (GP) visits and diagnostic tests.26
Since the introduction of Medicare, political changes have encouraged the greater uptake of private health insurance. In 1997, the Liberal–National coalition introduced a series of policies to encourage citizens — particularly higher earners — to take out private health insurance and thereby reduce pressure on the public health system.27
Among these policies was the Medicare levy surcharge. This was an increased levy of 1 percent on high-income earners who did not have private hospital insurance.28 This levy surcharge is now for up to 1.5 percent of taxable income and, as of 2024–25, the threshold for its payment is AUD 97,000 (USD 63,984) for individuals and AUD 194,000 (USD 127,968) for families.29 Australians earning less than this can receive a contribution from the government to help cover their private health insurance costs.30
The Role of Government
Australia is a federation, meaning that power is shared between three levels of government: federal, state or territory, and local. There are six state and two mainland territory governments. Australia’s health system is provided through collaboration between these three levels of government.31
The federal government develops the country’s health policy; funds Medicare and the PBS; and regulates medicines, devices, and private health insurance (see Pharmaceutical Spending). It also offers targeted funding for veterans, the elderly, and First Nations people and provides funds to states and territories to pay for public hospital services.32
State and territory governments manage public hospitals, which are funded by the federal government. They also regulate private health services, alcohol, and tobacco and oversee community health care, preventive services, and ambulances.33
Local governments provide public health initiatives and community and home-based health services.34
Integration and Care Coordination
Primary Health Networks (PHNs) are 31 independent bodies that play an important role in coordinating health services in Australia. Each PHN decides how it operates under defined national priorities; this autonomy is intended to give the networks the flexibility to focus on local needs.35 PHNs commission health services that will meet local needs, address gaps, and minimize duplication; however, PHN performance varies widely. In 2025, over 50 percent of GPs rated their local PHN’s value as poor or very poor.36
Australia’s 10-year primary health plan aims to improve integrated and multidisciplinary care and thereby encourage health professionals to collaborate more effectively (see Innovation and Reform).
Operations and Resources
Overview of the Delivery System
Primary care acts as a first point of contact for patients. It includes frequently accessed health care provisions such as nursing, midwifery, pharmacy, allied health care, and First Nations health services (which are provided by Aboriginal and Torres Strait Islander health practitioners and health workers employed in general practice).37
Secondary care includes treatment for complex conditions such as mental health, cancer, and palliative care, as well as pathology, imaging, and surgery assessments.38
Medicare reimburses health care providers on a fee-for-service basis through the MBS (see The Role of Public Health Insurance). It’s the primary funding source for most medical services.40 Private health care providers are either paid directly by insurers or by their patients, who are then reimbursed by their insurer.41
Public hospitals are funded through both activity-based and block funding. Activity-based funding ties payments to service volume and complexity and is based on a national cost standard. Block funding provides fixed budgets for services that can’t be funded on a per-activity basis. Such services might include provisions by very small or rural hospitals or essential functions such as teaching and research.42
There are other government programs, including the Department of Veterans’ Affairs, Workers’ Compensation and Accident Schemes, and the National Disability Insurance Scheme, that help to cover health care costs for eligible individuals.43
Primary Care
Primary health care is the first point of contact for patients and is provided in general practices, aged care facilities, and community health services by GPs, nurses, midwives, pharmacists, dentists, First Nations health workers, and allied health providers.
With multiple professionals providing primary care, patients aren’t required to have a GP.44 In 2022, Australia had 114 GPs for every 100,000 people, up from 111 in 2013.45 There are currently no data for the proportion of primary care physicians employed publicly versus privately.
GPs aren’t required to provide out-of-hours care, and availability varies by location and practice arrangements. In cities, some clinics offer extended hours, and medical deputizing services (which are organizations that provide after-hours care on behalf of GP clinics) help to fill the gaps. However, under Medicare rules, deputizing services can bill at higher out-of-hours rates, whereas GPs working from their own clinics can’t. This discourages GP practices from staying open late. In rural areas, GPs are more likely to manage after-hours care themselves, to share on-call duties, or to work at local hospitals.46
Medicare increased the number of subsidized primary care services from about 185 million in 2018–19 to about 197 million in 2022–23. This includes a 5 percent increase in the number of GP appointments, an 11 percent increase in allied health attendances, and a 21 percent increase in services provided by nurses and First Nations health workers.47
Australian government data show that the number of doctors has grown steadily, from 382 doctors (all doctors, including GPs) for every 100,000 people in 2013 to 442 doctors in 2022.48 This surpasses the 2022 World Health Organization Western Pacific average of 232.49
Outpatient/Specialist Care
The number of specialists in Australia declined significantly during the past decade; for example, it dropped from 177.9 for every 100,000 people in 2016 to 128.8 in 2017. Since then, however, numbers have risen steadily, reaching 148.5 for every 100,000 people in 2022. This figure is slightly above the ratio in Canada (a comparable country in terms of its economy and size), where there were 147.6 specialists for every 100,000 people in 2022.50
To see a specialist, patients typically need a referral from a primary health care provider. A referral is necessary to claim Medicare benefits; without one, patients will receive a reduced reimbursement or must pay the full fee.51
Not all specialist consultations are covered by the MBS. Exclusions include treatment for public hospital patients (which is funded separately, through activity-based funding), and services under government programs such as the Department of Veterans’ Affairs.52
In 2022–23, AUD 5.3 billion (USD 3 billion) was spent on Medicare-subsidized referred specialist consultations. Of this, 55 percent came from the government, while the rest (45%) came from out-of-pocket payments. Government spending on Medicare benefits has increased in real terms (after adjusting for inflation). However, when accounting for the changes in the number of patients, spending has decreased slightly on a per capita basis: from AUD 349 (USD 225) to AUD 341 (USD 225) for each person.53
The average cost of seeing a specialist has increased from AUD 140 (USD 92) to AUD 153 (USD 101), outpacing Medicare reimbursement rates. Medicare’s share of specialist visit costs fell from 64 percent in 2012–13 to 55 percent in 2022–23.54 These rising costs create barriers for some patients. In 2022–23, 22.5 percent of patients delayed or skipped specialist visits; of these, 10.5 percent said that cost was the reason.55
There are currently no data for the proportion of specialist medical practitioners employed publicly versus privately.
Physician Education and the Workforce
Between 2013 and 2022, the health care workforce increased by 37 percent. This change reflects the increased demand for health care professionals, which is driven by a growing and aging population, as well as the policy changes designed to impact workforce demand. However, the growth in the number of health care professionals is not keeping up with the aging population (see Long-Term Care and Social Support).56
The COVID-19 pandemic exacerbated the shortages in the health care workforce. Between 2020 and 2022, the annual increase in medical practitioners slowed to 3.2 percent (from 3.6% between 2013 and 2019). By 2023, 82 percent of health professions were reporting workforce shortages. The share of job vacancies filled dropped from 60 percent in 2022 to 44 percent in 2023, largely because of skill gaps.57
Workforce shortages in Australia are compounded by a reliance on foreign-trained health care professionals. In 2013, 29 percent of medical practitioners were trained abroad, a figure that increased to 32 percent by 2022. By 2022, 51 percent of intensive care specialists and about 44 percent of GPs were trained abroad. However, obtaining recognition for overseas medical qualifications is considerably more difficult in Australia than in the U.K., New Zealand, and Canada. Overseas health practitioners cite issues such as a lack of recognition of their expertise and experience, as well as complex, costly accreditation processes. In addition, the Medical Board of Australia only recognizes six competent authorities across five countries, far fewer than New Zealand (23 authorities), the U.K. (over 30 authorities, and Canada (eight authorities).58 Given that Australia faces international competition for talented medical professionals, this can make hiring and retention challenging.59
To expedite the process of hiring foreign-trained talent, the Australian government is streamlining the recognition of overseas qualifications. The government also implemented the National Medical Workforce Strategy 2021–31, which aims to improve workforce training and distribution.60 In October 2024, it launched the Expedited Specialist Pathway, which enables eligible credentialed medical specialists from Ireland, New Zealand, and the U.K. to fast-track their specialist registration.61
There are currently no data for the proportion of domestically trained health professionals who choose to work overseas.
Staff shortages are most severe in remote areas, where health care access is already limited. In these areas in 2022, there were 53 full-time-equivalent specialists for every 100,000 people, compared with 160 for every 100,000 in major cities.62
Rural areas tend to have fewer career opportunities, so medical graduates have consistently preferred to work in capital cities. In 2022, 62 percent of the medical students surveyed favored urban areas; only 21 percent preferred to work in regional cities, small towns, or rural communities.63 The 2018 Stronger Rural Health Strategy aims to provide 3,000 doctors and nurses to rural and remote areas by 2028.64
There are also workforce gaps between First Nations people and non-Indigenous Australians. In 2021, 89 First Nations people worked in health care related professions for 10,000 people, compared with 267 non-Indigenous Australians. The largest disparity was among nurses and midwives, with a gap of 87 for every 10,000 (37 per 10,000 population).65 The National Aboriginal and Torres Strait Islander Health Workforce Plan (2021–31) seeks to increase representation by expanding training and career pathways.66
The majority of GPs in Australia are self-employed. In 2021, self-employed GPs earned an average annual income of USD 98,789, the second lowest among 15 Organisation of Economic Co-operation and Development (OECD) countries and well below the OECD average of USD 151,183.67
Allied Health Services
Allied health refers to a wide variety of services offered by health care professionals who are not doctors, nurses, or dentists; these include physiotherapists, psychologists, optometrists, and First Nations health practitioners.68
Medicare typically does not cover allied health services, but it subsidizes some allied health services under the MBS, especially those offered to patients who have complex care needs or chronic conditions.69 In 2022–23, 39 percent of Australians accessed at least one Medicare-subsidized allied health service, with the most common being optometry, mental health care, podiatry, and physiotherapy.70
First Nations health practitioners play a critical role in providing culturally appropriate care, managing chronic disease, and addressing community-based health needs. In 2022–23, 4.2 percent of Australians used a Medicare-subsidized service from a First Nations health worker (see Addressing Health Inequities).71
Education
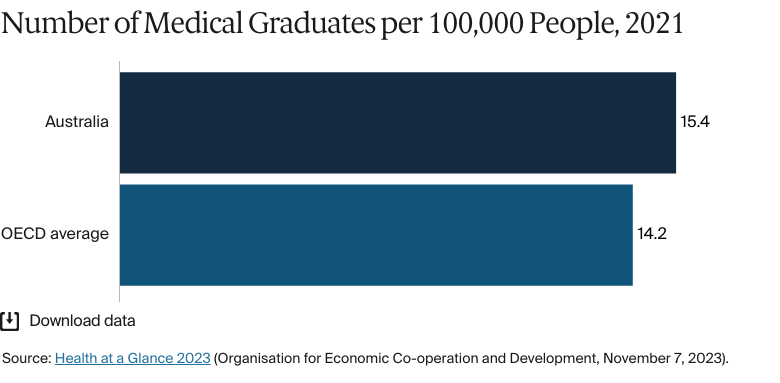
Medical education is provided by public and private universities. Aspiring doctors must complete an Australian Medical Council–accredited degree, followed by an internship and a residency.72 In 2021, Australia had 15.4 medical graduates for every 100,000 people, slightly above the OECD average of 14.2.73
In 2022, annual tuition fees for domestic students ranged from AUD 10,000 (USD 6,596) to AUD 40,000 (USD 26,385), and international students paid up to AUD 80,000 (USD 52,770).74 Australian citizens and certain visa holders can defer the payment of tuition fees via the Higher Education Contribution Scheme until they reach a specified income threshold.75
In July 2025, the government will introduce a weekly payment of AUD 320 (USD 211) to support those in mandatory clinical placements for teaching, nursing, midwifery, and social work.76 In 2023, New South Wales committed AUD 120 million (USD 79 million) toward medical education subsidies. This figure will pay for annual scholarships of AUD 4,000 (USD 2,639) for new students and one-time payments of AUD 8,000 (USD 5,277) for current students.77
Hospitals
BY THE NUMBERS
In 2022, there were 1,345 nurses and midwives per 100,000 people (compared with an average of 434 across the Western Pacific region).78
In 2022–23, patients waited 49 days for elective surgery, up from 39 days in 2019–20.79
In 2023–24, Australia had 704 public hospitals. Public hospitals are operated by state and territory governments and receive additional funding from the federal government. In contrast, private hospitals are managed by private organizations, including nonprofits, and are funded through patient fees, private insurance, and government subsidies.80
Hospital care accounted for AUD 114 billion (USD 75 billion) or 42 percent of total health expenditure in 2023–24. Of this, state and territory governments contributed the most (47%), followed by the federal government (36%) and nongovernment sources (17%).81
Public hospitals had an average of 67,300 beds in 2023–24.82
Australia faces long wait times for noncritical care. In 2024–25, half of emergency visits were completed within four hours, but 90 percent of the remaining patients waited up to 11.5 hours (10% waited longer).83 As regards elective surgery, 90 percent of patients were treated within 361 days in 2022–23, an increase from 279 days in 2018–19.84
Between 2013 and 2022, numbers of nursing and midwifery personnel grew considerably: from 1,155 for every 100,000 people to 1,307,85 figures that are well above the 2022 Western Pacific (434) and global (377) averages.86 While this growth is impressive, it has not kept pace with Australia’s aging population. In 2022–23, patients over age 65 accounted for 49.7 percent of public hospital bed days. This places considerable strain on capacity, as older patients are more likely to require longer hospital stays and experience comorbidities. Uneven distribution of health care workers further limits timely access to care (see Physician Education and the Workforce).87
Mental Health Care
BY THE NUMBERS
In 2020, there were 206 mental health professionals per 100,000 people (compared with 62 in high-income countries).88
In 2023, there were 16 psychiatrists per 100,000 people (compared with 9 across high-income countries in 2020).89
In 2023, 86 percent of psychiatrists were based in major cities, and fewer than 1 percent were based in remote areas.90
Mental health care is provided by both the public and private sectors.91 In 2021–22, the federal government allocated substantial funding to mental health through the MBS, the PBS, and PHNs, as well as targeted programs supporting veterans, individuals with disabilities, and low-income or unemployed individuals.92 For example, since 2023, Australians with stable, ongoing health conditions can buy a 60-day supply of their mental health medication for the cost of a single prescription (AUD 32 [USD 21] as of January 2024).93 This policy covers more than 300 PBS-listed medicines (see Pharmaceutical Spending).94
State and territory governments fund and provide public mental health services, including specialist hospital care, community programs, and programs in schools and correctional facilities.95
Services provided in private hospitals are funded through private health insurance, state and territory government-funded arrangements, or direct out-of-pocket payments. Alongside these, for-profit and nonprofit nongovernment organizations focus on well-being and crisis support through programs such as Lifeline and Kids Helpline.96
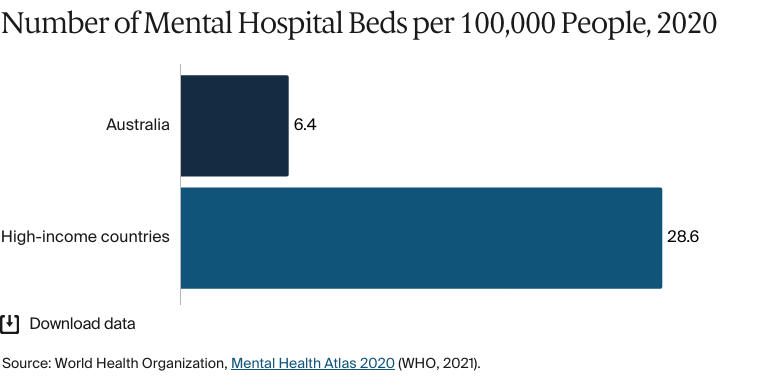
Despite these efforts, there are gaps in service availability. In 2020, there were significantly fewer mental hospital beds in Australia than in other high-income countries: 6.4 for every 100,000 people compared with 28.6.97 Limited access to inpatient care is compounded by workforce shortages, especially outside the major cities. In 2022–23, the mental health workforce grew to 68,000, up from 51,839 in 2020, and the number of psychiatrists increased to 16 for every 100,000 people (13.4 in 2020).98
Regional disparities are also a strain on the system. In 2023, 86 percent of psychiatrists worked in major cities, 14 percent served regional areas, and less than 1 percent (just 19 psychiatrists in total) were based in remote and very remote areas.99 This uneven distribution exacerbates access challenges for First Nations people, who face higher rates of mental health issues that are often linked to housing instability, social determinants, and intergenerational trauma (see Addressing Health Inequities).100
In response, the government launched the National Mental Health Workforce Strategy 2022–2032, a 10-year plan aimed at building a well-trained, well-supported, and evenly distributed workforce. The strategy is focused on addressing critical workforce shortages and improving distribution in regional and remote areas. It encourages growth by promoting better training, the hiring and retention of diverse talent, and enhanced collaboration across service sectors.101
Long-Term Care and Social Support
Long-term care includes aged care and support for chronic conditions. The government funds most services, covering about 75 percent of residential aged-care costs and 95 percent of home-care costs. Individuals contribute to accommodation costs and daily living expenses. There are safety nets for people with low incomes.102
As Australia’s population ages, demand for long-term care is increasing. The government projects that people age 65 and over will make up about 22 percent of the population by 2050, up from 17 percent in 2022.103 In 2021, 5.6 percent of Australians age 65 and over received institutional care (excluding hospital care), a figure that is above the OECD average of 3.6 percent.104 The Department of Health, Disability and Aged Care estimates that the number of older adults using home care will grow by an average of 44,000 each year, reaching nearly 2 million patients by 2042. To improve access, the government introduced the Support at Home Program in 2025.105
Notably, 69 percent of residential aged care providers reported operating losses in 2021–22. Many rely on refundable accommodation deposits, which allow residents to pay for their stay with an upfront lump sum. This model creates liquidity risks, as sometimes many deposits must be paid at once, or fewer new deposits are received. For this reason, the government plans to shift to a rental-style system by 2035.106
Chronic conditions affect 61 percent of Australians and create more demand for long-term care. Medicare’s chronic disease management plans offer some subsidized allied health services, but demand exceeds availability, and those in disadvantaged or regional areas face greater barriers to access (see Addressing Health Inequities).107
Low wages, demanding conditions, and limited career opportunities are problems that affect hiring and staff retention in health care. In response, in 2023–24, the government committed AUD 11.3 billion (USD 7 billion) to increase wages, expand home care services, and implement mandatory staffing reforms, including a requirement for residential care to have a registered nurse on-site at all times.108
First Nations people have higher rates of chronic conditions and often need long-term care earlier. Their eligibility for government-funded aged care services starts at age 50 (instead of 65), but many face roadblocks to care. In 2023–24, 12 percent of First Nations people age 50 and over received support to care for themselves independently at home. Just 4.6 percent used more extensive home care, and 1.2 percent received residential aged care. The National Aboriginal and Torres Strait Islander Flexible Aged Care Program offers culturally appropriate services, allowing Indigenous people to receive support closer to their communities. In 2024, the program funded 1,659 places across home and residential aged care.109
Cost and Affordability
Health Care Spending Overview
Australia’s health care spending steadily increased from 2011 to 2021, followed by a slight retraction in real terms in the 2022–23 period as spending returned to the pre-pandemic trend. While longer-term growth over this period was driven by more general factors, such as population increase, the 2020–22 period saw a sharp spike in spending driven by the COVID-19 pandemic: from AUD 203 billion (USD 134 billion) in 2019–20 to AUD 241 billion (USD 159 billion) in 2021–22.110
In 2023–24, total health spending was 10.1 percent of gross domestic product (GDP 1.1% more in real terms than in 2022–23), compared with an average of 8.1 percent across high-income countries.111 The government continues to be the largest contributor to health expenditure, at 74 percent of total health spending in 2022 (up from 71% in 2017).112
Pharmaceutical Spending
The PBS is an important part of Australia’s pharmaceutical system. It subsidizes prescription medicine costs to improve affordability.113
In 2023, in response to consumer advocacy, the standard copayment for PBS medicines was reduced from AUD 43 (USD 28) to AUD 30 (USD 20). Further cost-of-living measures have frozen standard copayments at AUD 32 (USD 21) until 2026 and at AUD 8 (USD 5) for concession cardholders until 2030.114
The optional pharmacy discount was introduced in 2016 to enhance competition between pharmacies and reduce the cost of medicines. It allowed pharmacies to reduce PBS copayments by up to AUD 1 (USD 1) at their discretion. However, following reports that suggested the discount did not lead to equitable outcomes, this is being phased out.115 The Pharmacy Guild supported the discount’s removal, arguing that it undermined the universality of the PBS.116
To be listed on the PBS, medicines must first be approved by the Therapeutic Goods Administration. They are then reviewed by the Pharmaceutical Benefits Advisory Committee. If a medicine offers additional health benefits at a reasonable cost compared with existing treatments, the federal government negotiates with the supplier to arrange its inclusion in the PBS.117
The government’s share of total pharmaceutical spending fell from 52 percent in 2010 to 45 percent in 2018.118 The total health care spend on pharmaceuticals is lower in Australia than in comparable countries; for example, in Canada, it was 13.8 percent in 2021, compared with 12.1 percent in Australia.119
Government per capita spending on PBS medicines rose by 13 percent between 2021–22 and 2022–23. This was due to inflation, lower copayments, and new high-cost medicines.120
Cost Sharing and Out-of-Pocket Spending
Overall, out-of-pocket spending has steadily declined. In 2022, it accounted for 15.3 percent of total health spending, down from 20.6 percent in 2000. This is still slightly above the average for high-income countries (13.2% in 2022).121
“The government sets what it considers a fair price to see a dermatologist or ophthalmologist. But doctors can charge well above that, and patients have to pay the gap out of pocket,” explains Elizabeth Deveny. “That’s been a big problem.”
Spending on non-PBS medicines has risen, shifting more costs to individuals.122 Because people are buying more non-PBS medicines, the share of out-of-pocket pharmaceutical expenses increased from 47 percent in 2010 to 55 percent in 2020.123
There are currently no data available for the number of Australians pushed below the poverty line because of health expenditure.
One important feature of the system is the use of health technology assessments, which aims for Medicare to only cover treatments that are clinically effective, cost-effective, and safe.125 Most taxpayers contribute to Medicare through a 2 percent levy on their taxable income, while those with lower incomes pay a reduced rate or are exempt (see The Role of Private Health Insurance).126
For PBS-listed medicines, the government negotiates discounts with pharmaceutical companies to reduce costs. So despite a 23 percent rise in pharmaceutical spending between 2010 and 2018, these discounts mean that net pharmaceutical revenue increased by just 5 percent between 2010 and 2019 (see Pharmaceutical Spending).127
Quality and Outcomes
Health Outcomes
BY THE NUMBERS
In 2023, life expectancy at birth was 84 years (the same as the average across High-Income Asia Pacific):128
Life expectancy for women was 85 years in 2021–23 (compared with 87.1 years in High-Income Asia Pacific).129
Life expectancy for men was 81 years in 2021–23 (compared with 81 in High-Income Asia Pacific).130
In 2023, the avoidable mortality rate was 97 deaths per 100,000 people (compared with 158 across OECD countries).131
Ischemic heart disease: 47 deaths per 100,000 people
Alzheimer’s disease and other dementias: 43 deaths per 100,000 people
Stroke: 25 deaths per 100,000 people.
The maternal mortality rate was 2 deaths per 100,000 live births in 2023 (compared with an average of 10 across high-income countries in 2023).133
In 2023, the infant mortality rate was 3 deaths per 1,000 live births (compared with an average of 4 across high-income countries).134
In 2025, the share of the population with mental health disorders was 22 percent.135
The suicide rate was 12 per 100,000 people in 2023 (3,214 deaths).136
In 2023, guns were responsible for one death in every 100,000.137
32 percent of adults were affected by obesity in 2022.138
In 2021–23, life expectancy was 81.1 years for men and 85.1 years for women.139
In 2023, there were 97 avoidable deaths for every 100,000 people. Rates were significantly higher for men (126 for every 100,000) than for women (69 for every 100,000).140 Australia’s avoidable mortality rate is considerably lower than Canada’s, which saw 184 avoidable deaths for every 100,000 people in 2022.141
The maternal mortality rate was low in 2023: 2 deaths for every 100,000 live births. This figure is well below the averages for high-income (10) and OECD member (17) countries.142
Deaths from dementia, including Alzheimer’s disease, have increased by 39 percent since 2014. Since 2016, dementia has been the leading cause of death for women: 47 deaths for every 100,000 in 2023, compared with 37 for every 100,000 for men.143
In 2021, homelessness affected 480 of every 100,000 people. This figure is much higher than the homelessness in Canada, for example, where 100 out of every 100,000 people were homeless in 2022.144
Addressing Health Inequities
Health inequities in Australia disproportionately affect low-income individuals, people in remote areas, and First Nations people. These groups often overlap and face similar barriers to care.
Health care access is a major challenge for remote communities. Between 2018 and 2022, the age-standardized death rate in very remote areas was 1.6 times higher than in major cities.145
First Nations people, who make up 32 percent of remote and very remote populations, experience even starker disparities.146 Between 2020 and 2022, they lived an average of eight years less than non-Indigenous people; this gap was 12 years in remote and very remote areas.147
Socioeconomic factors also limit accessibility. In 2021, high-income individuals were nearly twice as likely as low-income individuals to report good health.148
The ongoing disparity in health outcomes between First Nations and non-Indigenous people is called the “health gap.” From 2017 to 2019, there was a 24-percentage-point health gap between the two groups. This was caused by racial discrimination; disparities in income, educational participation and employment; barriers to accessing care; and susceptibility to health conditions.149 All of these factors are driven by the enduring impacts of colonization.150 In 2021, 35 percent of First Nations adults were in the lowest income quintile (Quintile 5), compared with 20 percent of non-Indigenous people.151 Food insecurity contributed to a 2021 obesity rate of 46 percent for Indigenous people, compared with 30 percent for non-Indigenous people.152 Smoking was also more prevalent: 41 percent of First Nations people smoked in 2018–19, compared with 14 percent of non-Indigenous people.153
People with disabilities also face health care inequities and barriers. In 2018, 8.7 percent of people under age 65 with disabilities (double the rate of the general population [4.1%]) delayed or missed their GP visits, primarily because of cost and wait times. About 24 percent reported experiencing unacceptable wait times, while 47 percent saw multiple professionals for the same condition. Remote areas were more affected by these issues than urban areas.154
In 2024, the federal government introduced monetary incentives to attract more doctors to rural and remote areas, offering GPs up to AUD 21,000 (USD 13,852) a year.155 The National Agreement on Closing the Gap (2020) aims to improve the health and well-being of First Nations people. Its objective is to close the life expectancy gap between Indigenous and non-Indigenous people by 2031.156
Innovation and Reform
Health Care Innovation
Person-Centered Care and the Dignity of Risk in Aged Care
Australia’s Aged Care Act 2024, which commenced in November 2025, introduced new standards that emphasize person-centered care. The objective is to help older Australians make informed care decisions while maintaining their independence. The act includes the “dignity of risk” principle, which recognizes that reasonable risk-taking can support autonomy and quality of life.157
The Primary Health Care 10-Year Plan 2022–32
Among its many objectives, Australia’s 10-year primary health care plan aims to improve integrated and multidisciplinary care to encourage GPs, allied health professionals, and community services to collaborate more effectively.158
More than 428 million MBS services are provided annually. Nearly 50 percent of people are estimated to have one or more of the 10 most common chronic conditions, and chronic disease contributes to one in three preventable hospitalizations. People living in rural and remote areas are at higher risk and have poorer access to primary health care services. The government expects integrated primary care at the local level to play a major role in improving health outcomes over time.159
Partnering with Consumers Standard
The National Safety and Quality Health Service Partnering with Consumers Standard prioritizes consumer involvement in health care service planning, design, and evaluation. The goal is to strengthen the partnerships between policymakers and the community and to make consumer partnership a fundamental aspect of health service delivery.160
Police, Ambulance, Clinical Early Response
The Police, Ambulance, Clinical Early Response model, which was developed in 2019, seeks to reduce the involuntary detention of people living with mental illness through the greater integration of the emergency services. Emergency responders dispatch a mental health nurse and a plain-clothes police officer, instead of a police car, to handle mental health crises.161
Health Care Technology
The Digital Health Strategy
Launched in February 2024, the National Digital Health Strategy 2023–2028 is a five-year plan developed by federal, state, and territory governments to enhance the integration, security, and accessibility of digital health care. The program has been shaped through extensive consultations with consumers, carers, health care providers, research organizations, and technology innovators. It aims to provide equitable access to health services and will give citizens greater control over their personal health and well-being through advances in digital technology.162
Fast Healthcare Interoperability Resources (Sparked)
Fast Healthcare Interoperability Resources (FHIR) is the internationally recognized standard for securely and efficiently exchanging health care data between systems.163
In 2023–24, the government invested AUD 15 million (USD 10 million) to improve real-time data and information sharing. Part of the funding went towards the development of Australia’s first FHIR Accelerator (Sparked), which aims to deliver FHIR standards by June 2025.164
Telehealth
Following its rapid expansion during the COVID-19 pandemic, telehealth has become integral to the health care system. Medicare-supported telehealth services are now available for GPs, nurse practitioners, and allied health providers. In 2022–23, there were 1.8 million videoconferencing consultations, up from 1.7 million in 2021–22. This reflects the shift toward video-based care. Telehealth also supports hospital-in-the-home models and provides continuity of care outside of hospital settings.165
Socioeconomic factors influence usage, with 18.2 attendances for every 100 people in the most advantaged areas (Quintile 5), compared with 9.2 for every 100 in the most disadvantaged areas (Quintile 1).166
Electronic Health Records
“My Health Record” is a secure online system that stores patient information.167 As of September 2025, there were more than 24 million active My Health Records. Adoption among health care providers is high: 99 percent of GPs and pharmacies and 97 percent of public hospitals are registered. Uptake among specialists (67%) and aged care providers (52%) is comparatively low.168
E-prescription services allow patients to digitally store and manage multiple prescriptions. Between May 2020 and April 2024, more than 219 million e-prescriptions were issued.169
This content was produced by FT Longitude, the specialist research and content marketing division of the Financial Times Group, on behalf of the Commonwealth Fund. Research and content for the Commonwealth Fund country profiles were collected by FT Longitude between February and December 2025.
This profile reflects data as of February 2026. New or updated information may have become available since its release.
“Ambulance,” PrivateHealth.gov.au, accessed November 10, 2025, https://privatehealth.gov.au/health_insurance/what_is_covered/ambulance.htm; Australian Institute of Health and Welfare, Health System Overview; “Medicare services for conceiving, pregnancy and birth,” Services Australia, last updated August 15, 2025.
↩
Winnie Chen et al., “Understanding general practice funding models in Australia and beyond.” Australian Journal of General Practice 53, no. 12 (2024), https://doi.org/10.31128/AJGP-01-24-7132.
↩
Australian Institute of Health and Welfare, Health Workforce; figures calculated using population data from World Bank Open Data, Population, total, distributed by World Bank Group, accessed November 10, 2025, https://data.worldbank.org/indicator/SP.POP.TOTL.
↩
“Aboriginal and Torres Strait Islander people in the health workforce,” in Aboriginal and Torres Strait Islander Health Performance Framework (Australian Institute of Health and Welfare and National Indigenous Australians Agency, last updated January 17, 2025), https://www.indigenoushpf.gov.au/Measures/3-12-atsi-people-health-workforce.
↩
Australian Institute of Health and Welfare, Health Workforce”; World Health Organization, Density of nursing and midwifery personnel (per 10,000 population), distributed by WHO, accessed November 6, 2025, https://data.who.int/indicators/i/B54EB15/5C8435F.
↩
Australian Institute of Health and Welfare, “Medicare costs.”
↩
126
Australian Institute of Health and Welfare, “Medicare costs.”
↩
127
IQVIA Institute, Understanding Medicine Spending.
↩
128
Global age-sex-specific all-cause mortality and life expectancy estimates for 204 countries and territories and 660 subnational locations, 1950–2023: a demographic analysis for the Global Burden of Disease Study 2023, (The Lancet), accessed November 14, 2025, https://www.thelancet.com/action/showPdf?pii=S0140-6736%2825%2901330-3↩
Australian Bureau of Statistics, Causes of Death.↩
133
“Maternal mortality,” World Health Organization, February 9, 2026, https://www.who.int/data/gho/data/indicators/indicator-details/GHO/maternal-mortality-ratio-(per-100-000-live-births).
↩
Institute for Health Metrics and Evaluation, GBD Compare, distributed by IHME, accessed November 10, 2025, https://vizhub.healthdata.org/gbd-compare/ (overall firearm mortality is an aggregate of physical violence by firearm, self-harm by firearm, and unintentional injuries by firearm).
↩
“Income,” in Aboriginal and Torres Strait Islander Health Performance Framework (Australian Institute of Health and Welfare and National Indigenous Australians Agency, last updated May 21, 2024), https://www.indigenoushpf.gov.au/measures/2-08-income.
↩
152
“Overweight and obesity,” in Aboriginal and Torres Strait Islander Health Performance Framework (Australian Institute of Health and Welfare and National Indigenous Australians Agency, last updated May 21, 2024), https://www.indigenoushpf.gov.au/measures/2-22-overweight-obesity.
↩
153
Australian Institute of Health and Welfare and National Indigenous Australians Agency, “Income”; “Tobacco use,” in Aboriginal and Torres Strait Islander Health Performance Framework (Australian Institute of Health and Welfare and National Indigenous Australians Agency, last updated May 21, 2024), https://www.indigenoushpf.gov.au/measures/2-15-tobacco-use.
↩
Australian Institute of Health and Welfare, Referred Medical Specialist Attendances; Department of Health, Disability and Ageing, 10 Year Plan 2022–2032.↩
166
Australian Institute of Health and Welfare, Referred Medical Specialist Attendances.↩
Explore how countries compare on key health system characteristics including health care coverage and spending, the health workforce, health outcomes, and more.